Features
The features of the Seneca Controlling Software at a glance.
Good controlling software gives you, the decision-maker, the necessary overview of your financial figures. This gives you an overview of your figures, not only at the end of the quarter, semi-annually or at the end of the year, but daily. The following Seneca controlling features will help you set concrete targets for your financial planning and show you optimization potential in your company.
Planning
Create your budget and forecast in a modern and professional way
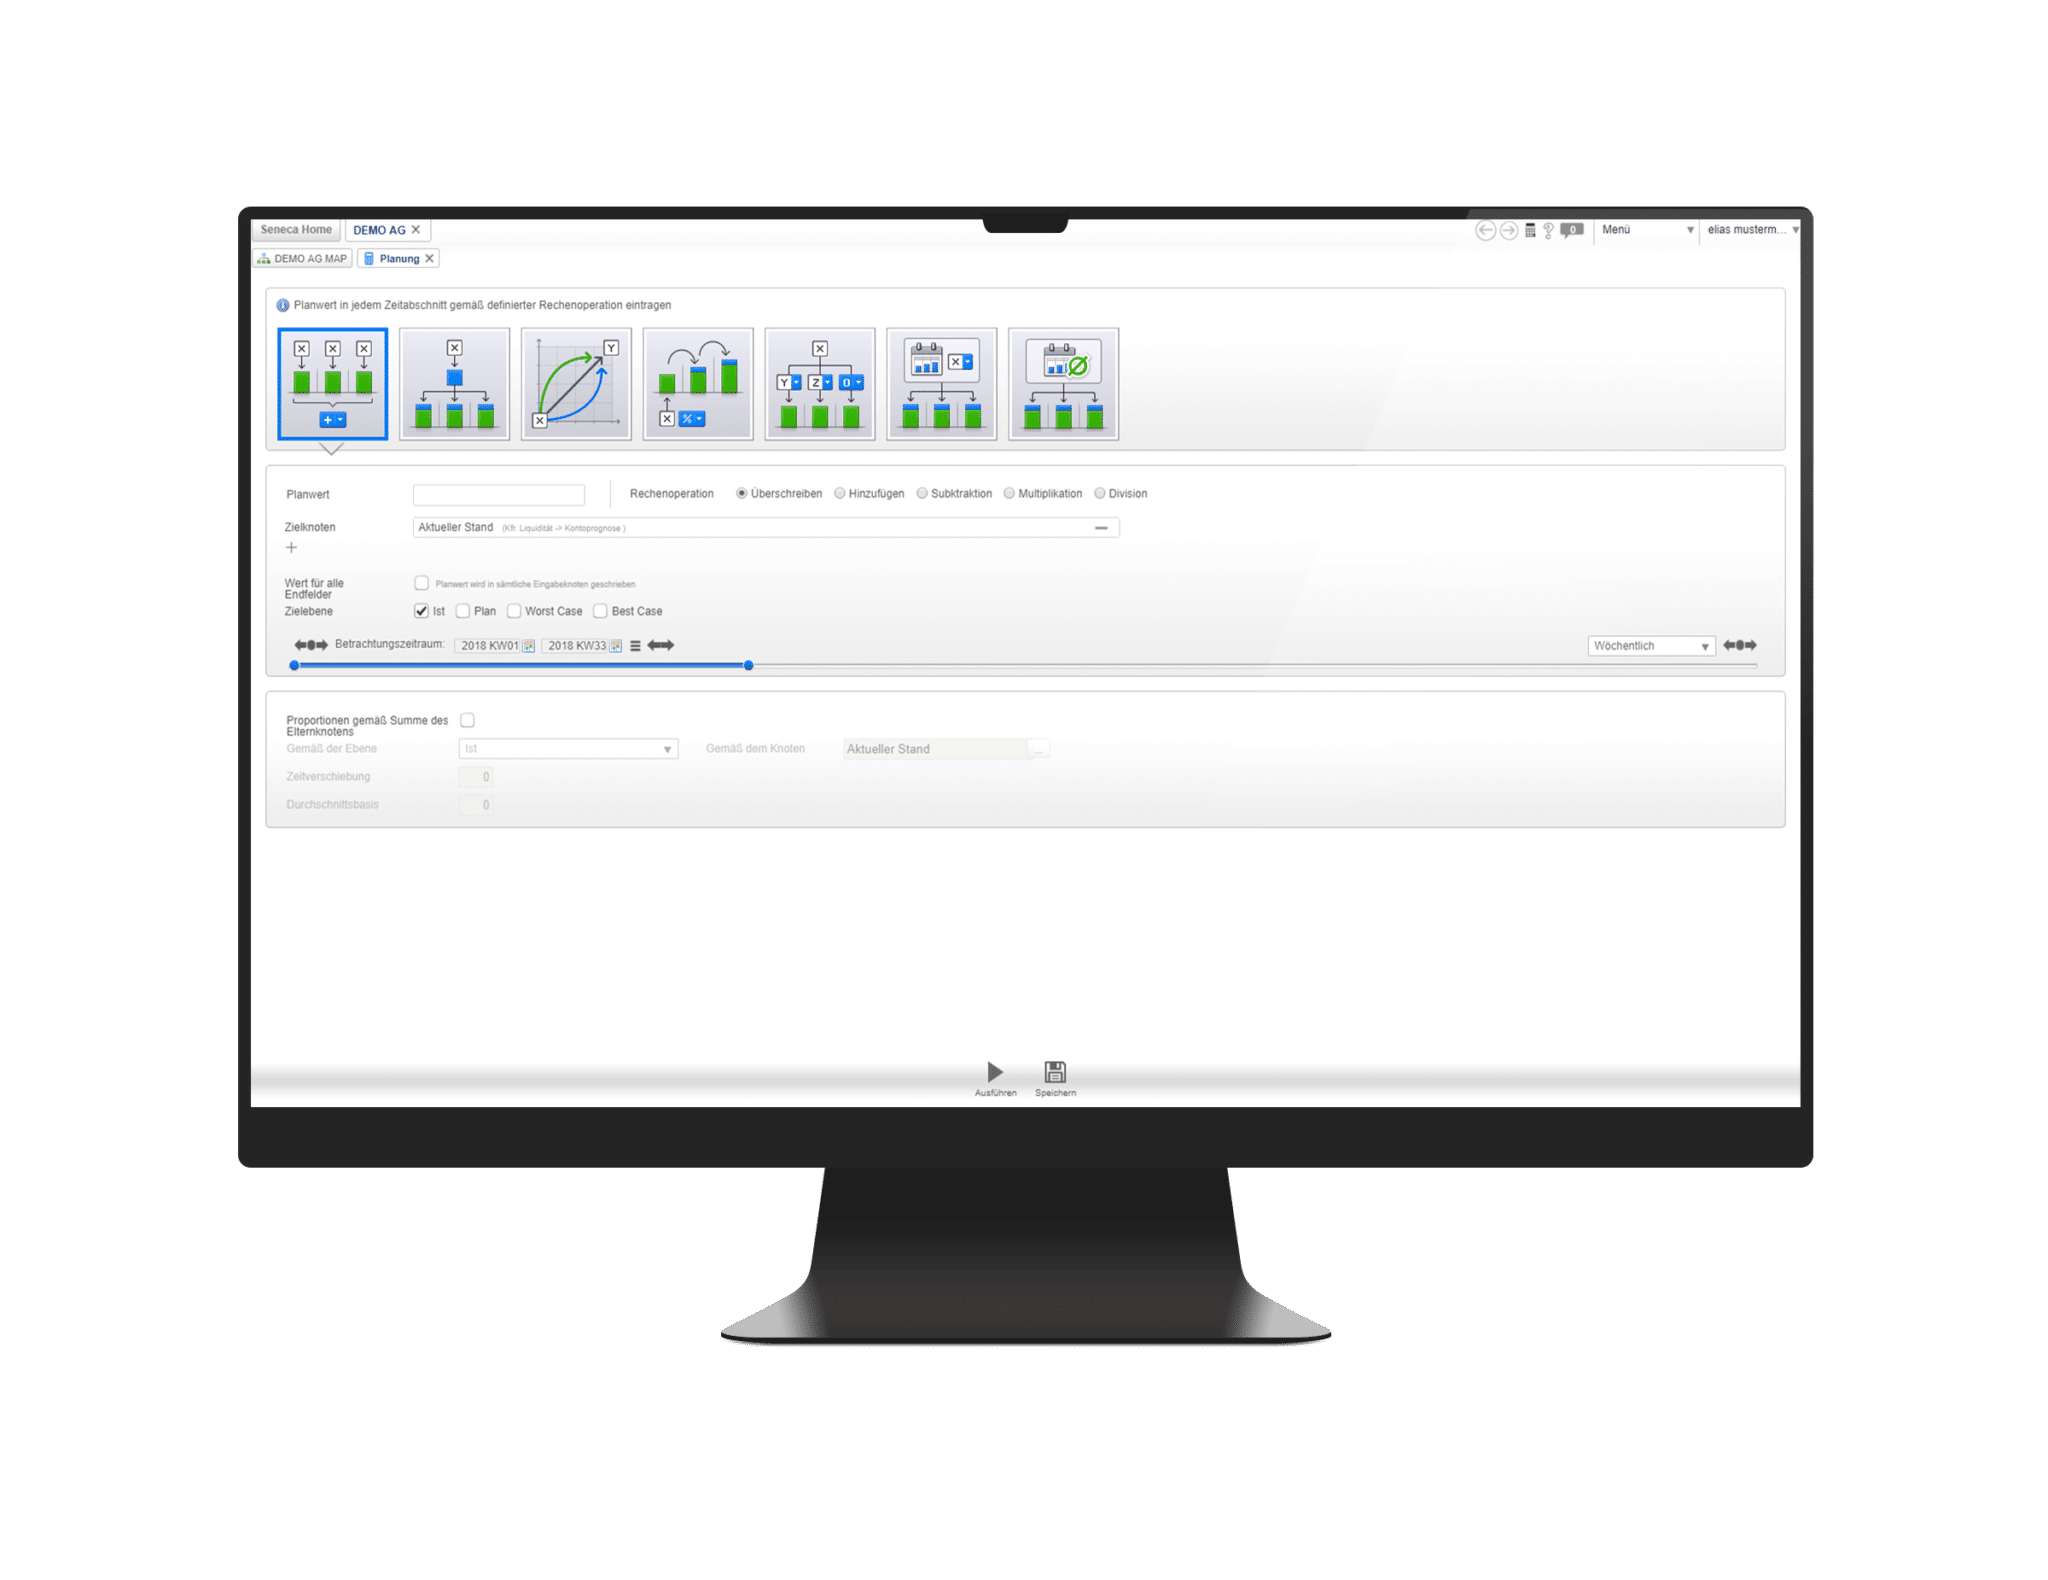
By using top-down and bottom-up as well as seasonal planning and increasing factors you can simulate numerous scenarios. Operate with given planning options – independent of period and granularity (day, month, year…). A huge number of given formulas enable a broad scope of planning. Plan various regions, products and groups of customers by using customized increasing values and all kinds of units (tons, Euros, percents…).
Analysis
Reliable figures ensure the future of your company
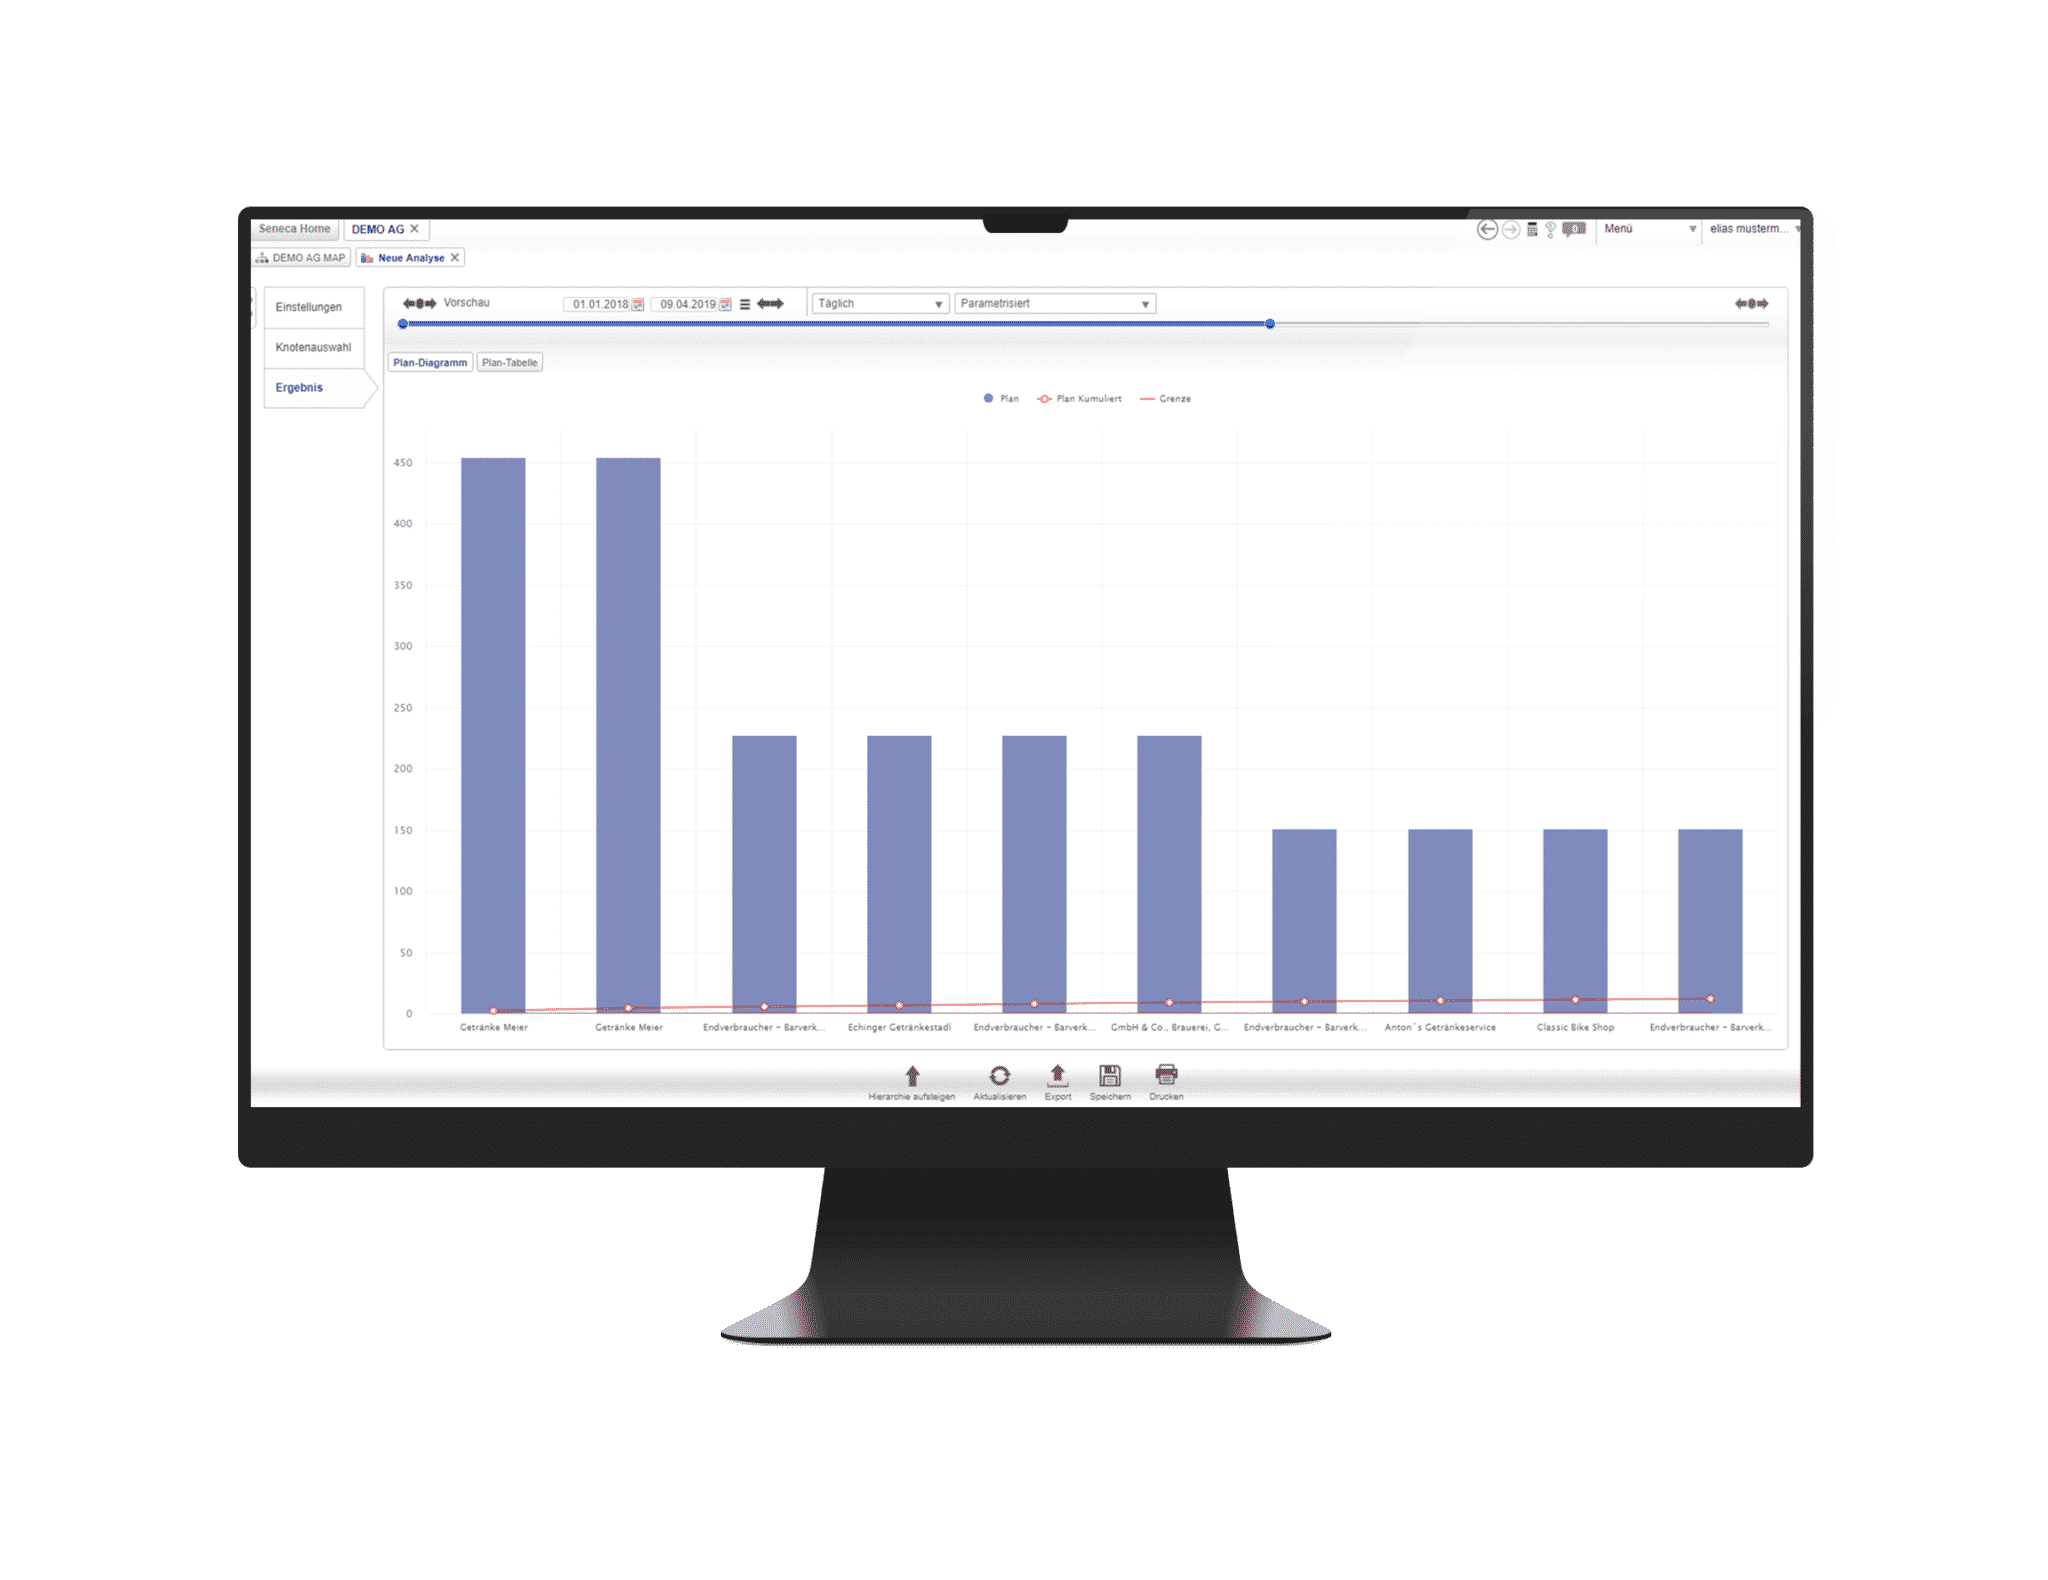
Define your client structure and identify your tops and flops with ABC and Pareto evaluations. Compare various planning variants with your latest data and be able to illustrate the discrepancy of your absolute and your relative values based on tabular accounts. All data of your company can get summarized graphically by using combined graphics like area, pie and bar charts.
Reporting
Reports, as quick as possible!
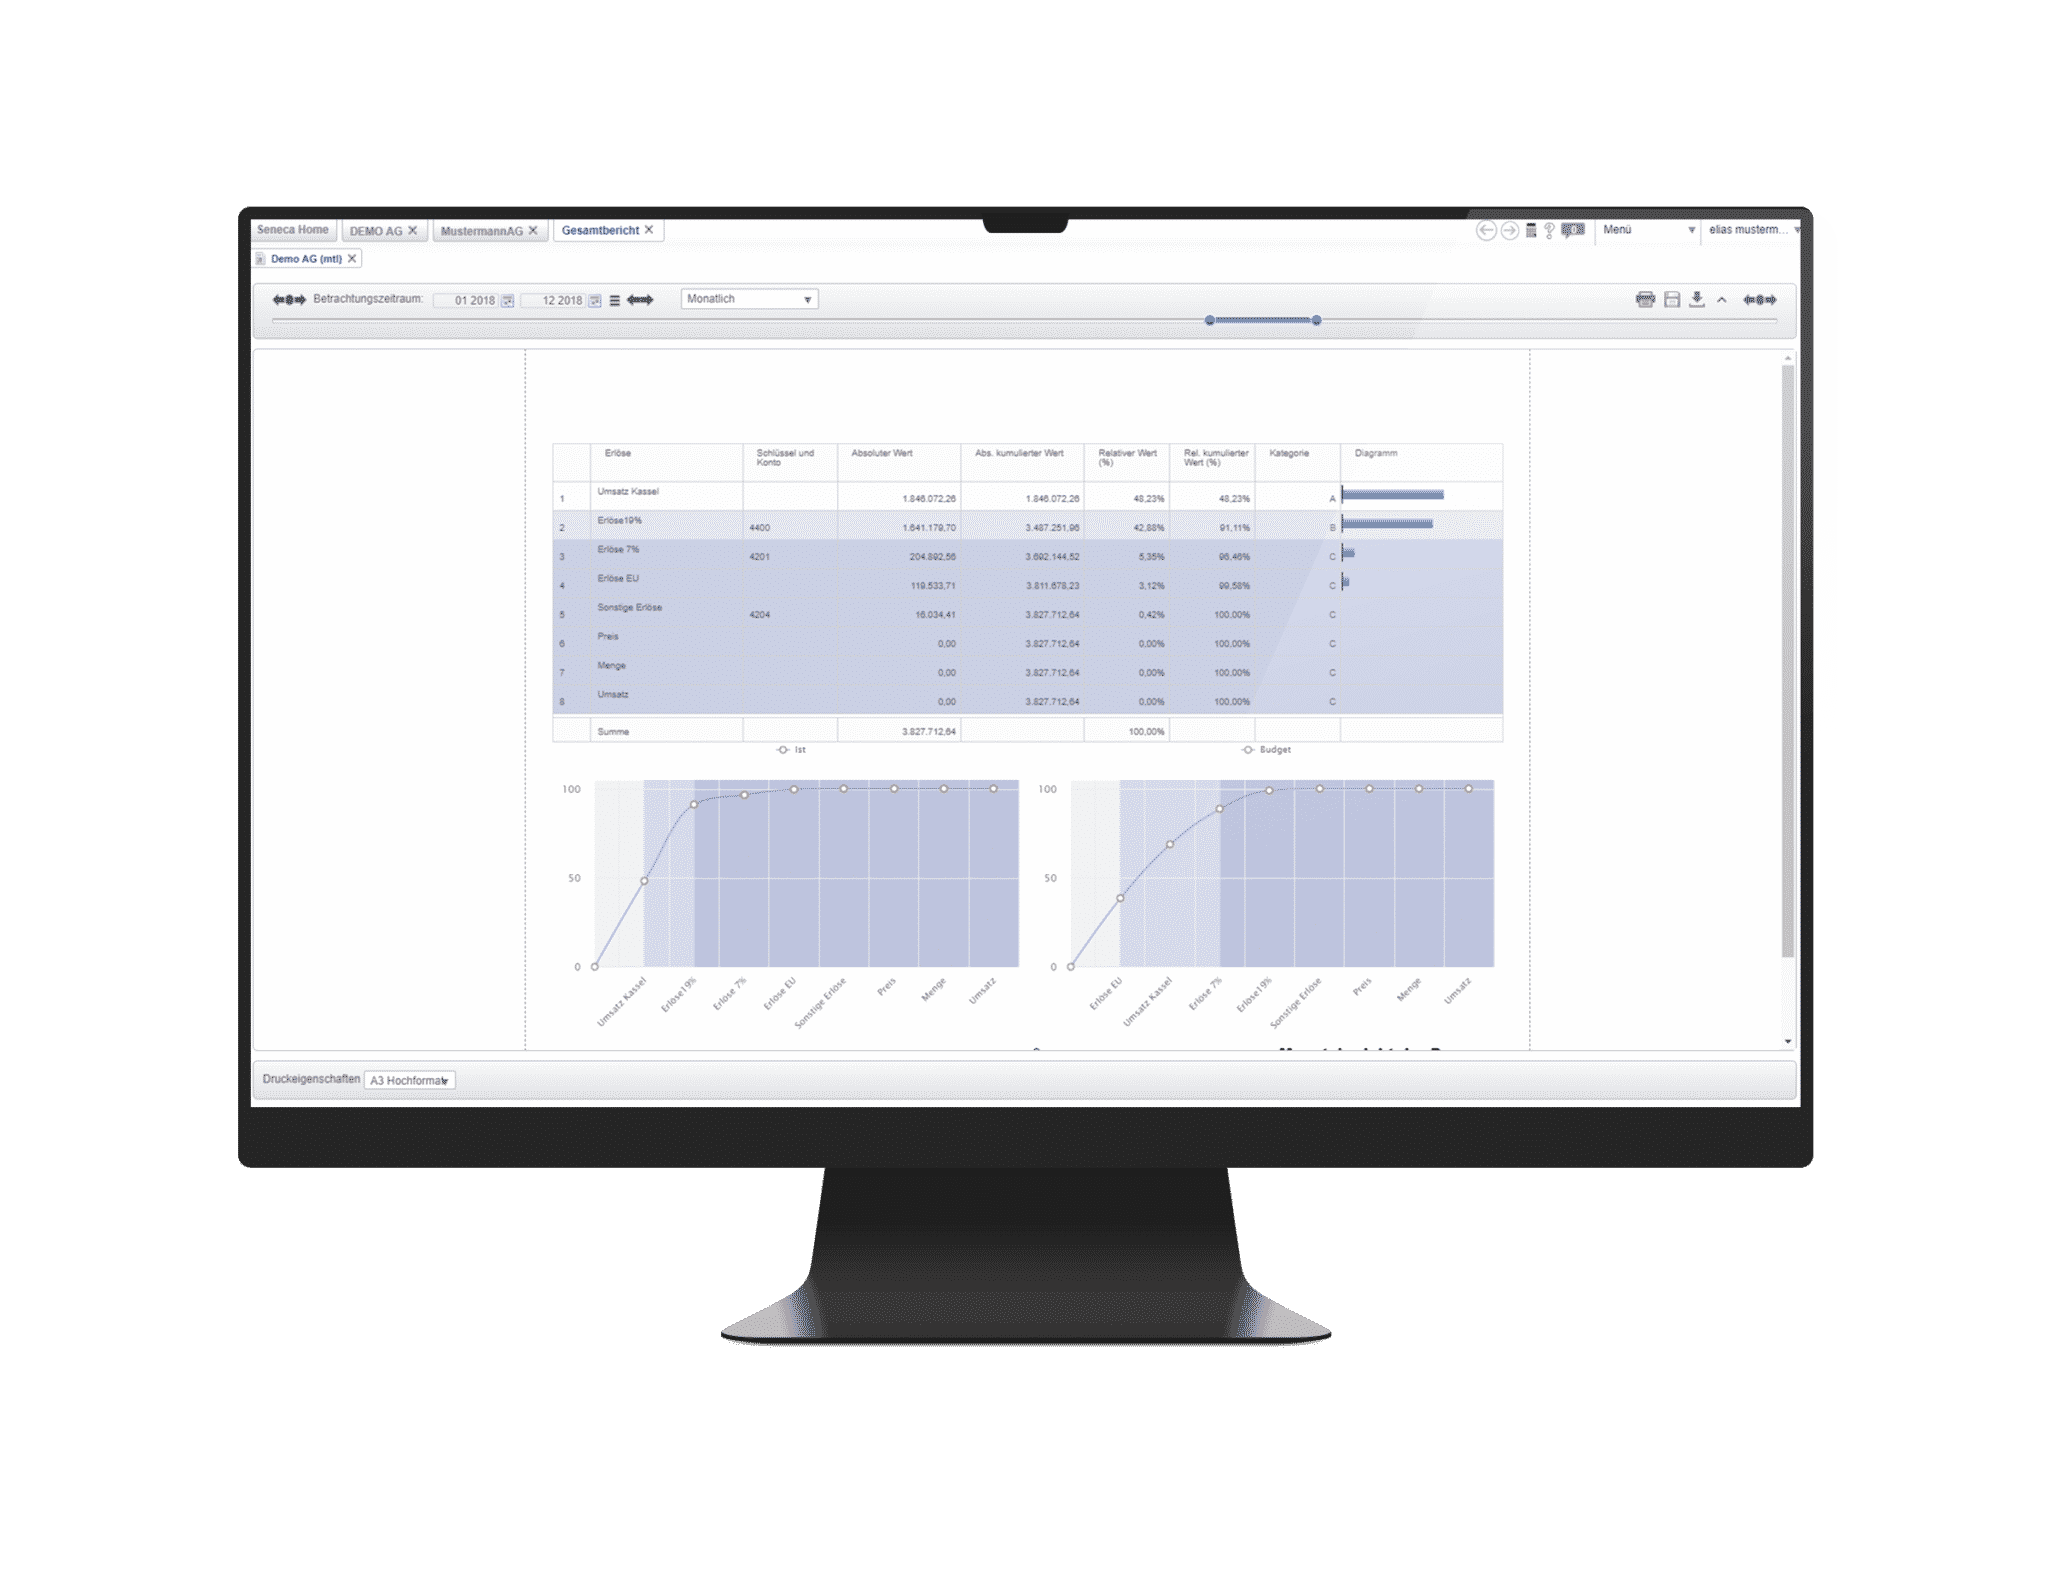
Dashboards provide the most important facts at one glance. Speedometers, traffic lights displays and progress bars are automatically updated. Tabular reports are easily made, are formatted professionally and are exported to Excel. Additionally, the period of dynamic customization can be chosen freely. Each analysis, report and graphic can get consolidated and combined in company-wide briefing books via drag and drop. At last, you will have the option to transfer the report into a presentation mode or you can create a pdf of it.
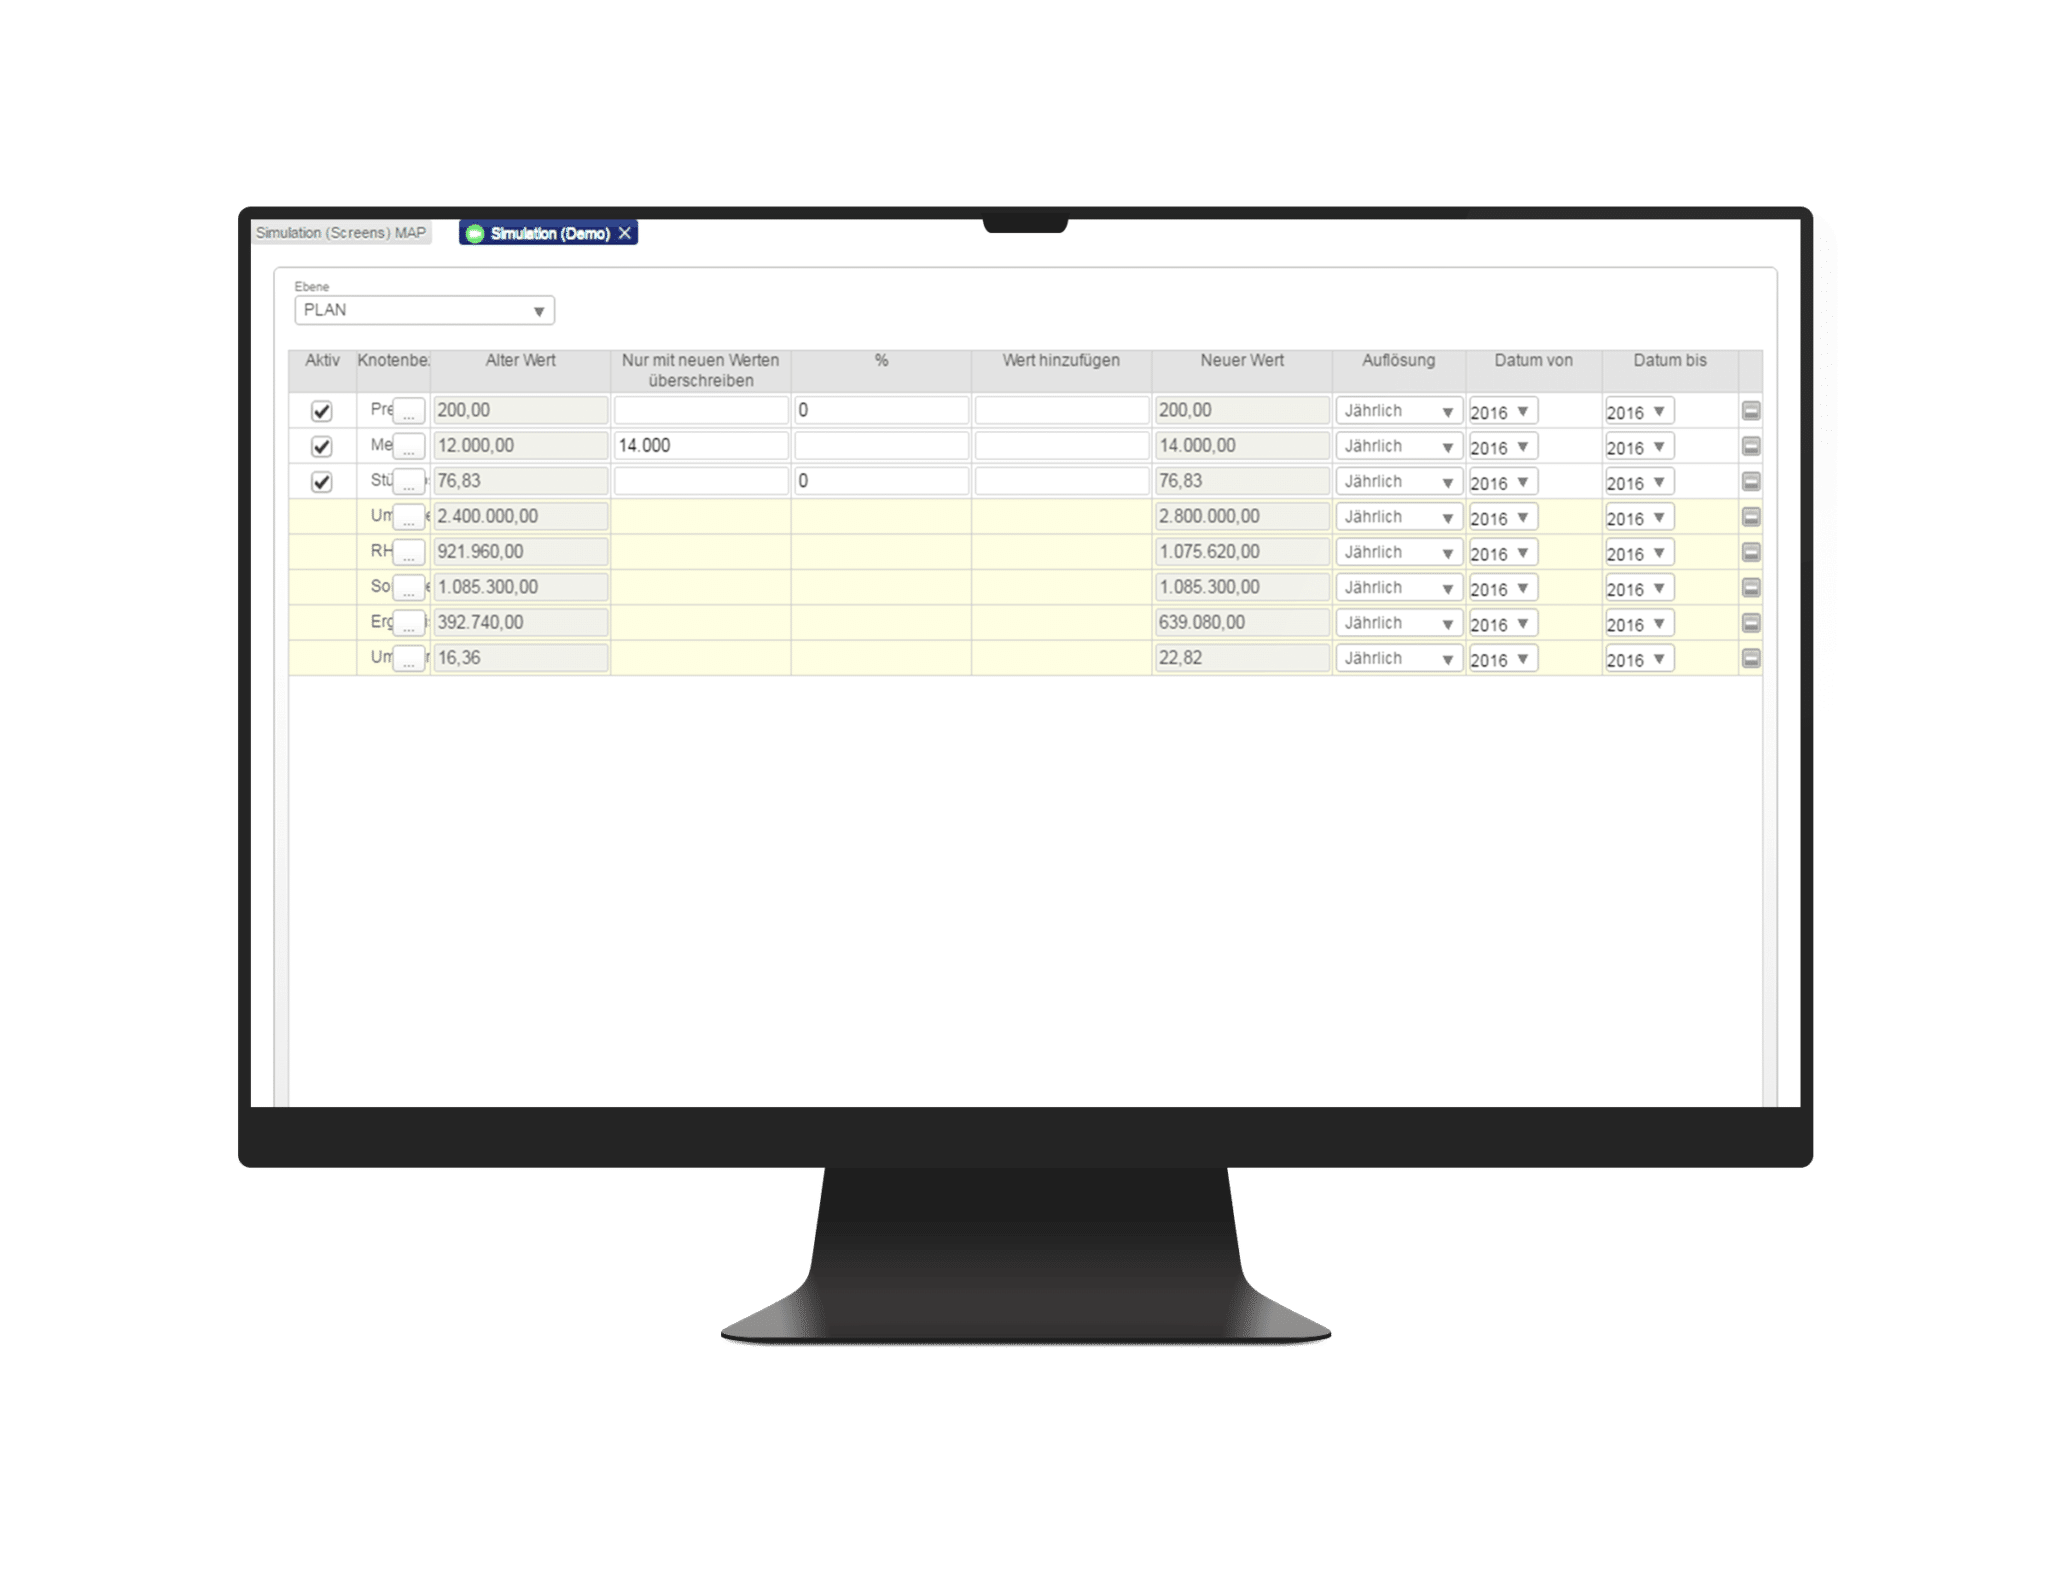
Simulation
Calculate your actions, make the correlations transparent
Simulate various scenarios and you will receive an immediate overview of your before and after results.
Use the simulation for Ad-hoc-analysis for planning or for fundamental analysis to identify the optimize potential of your business.
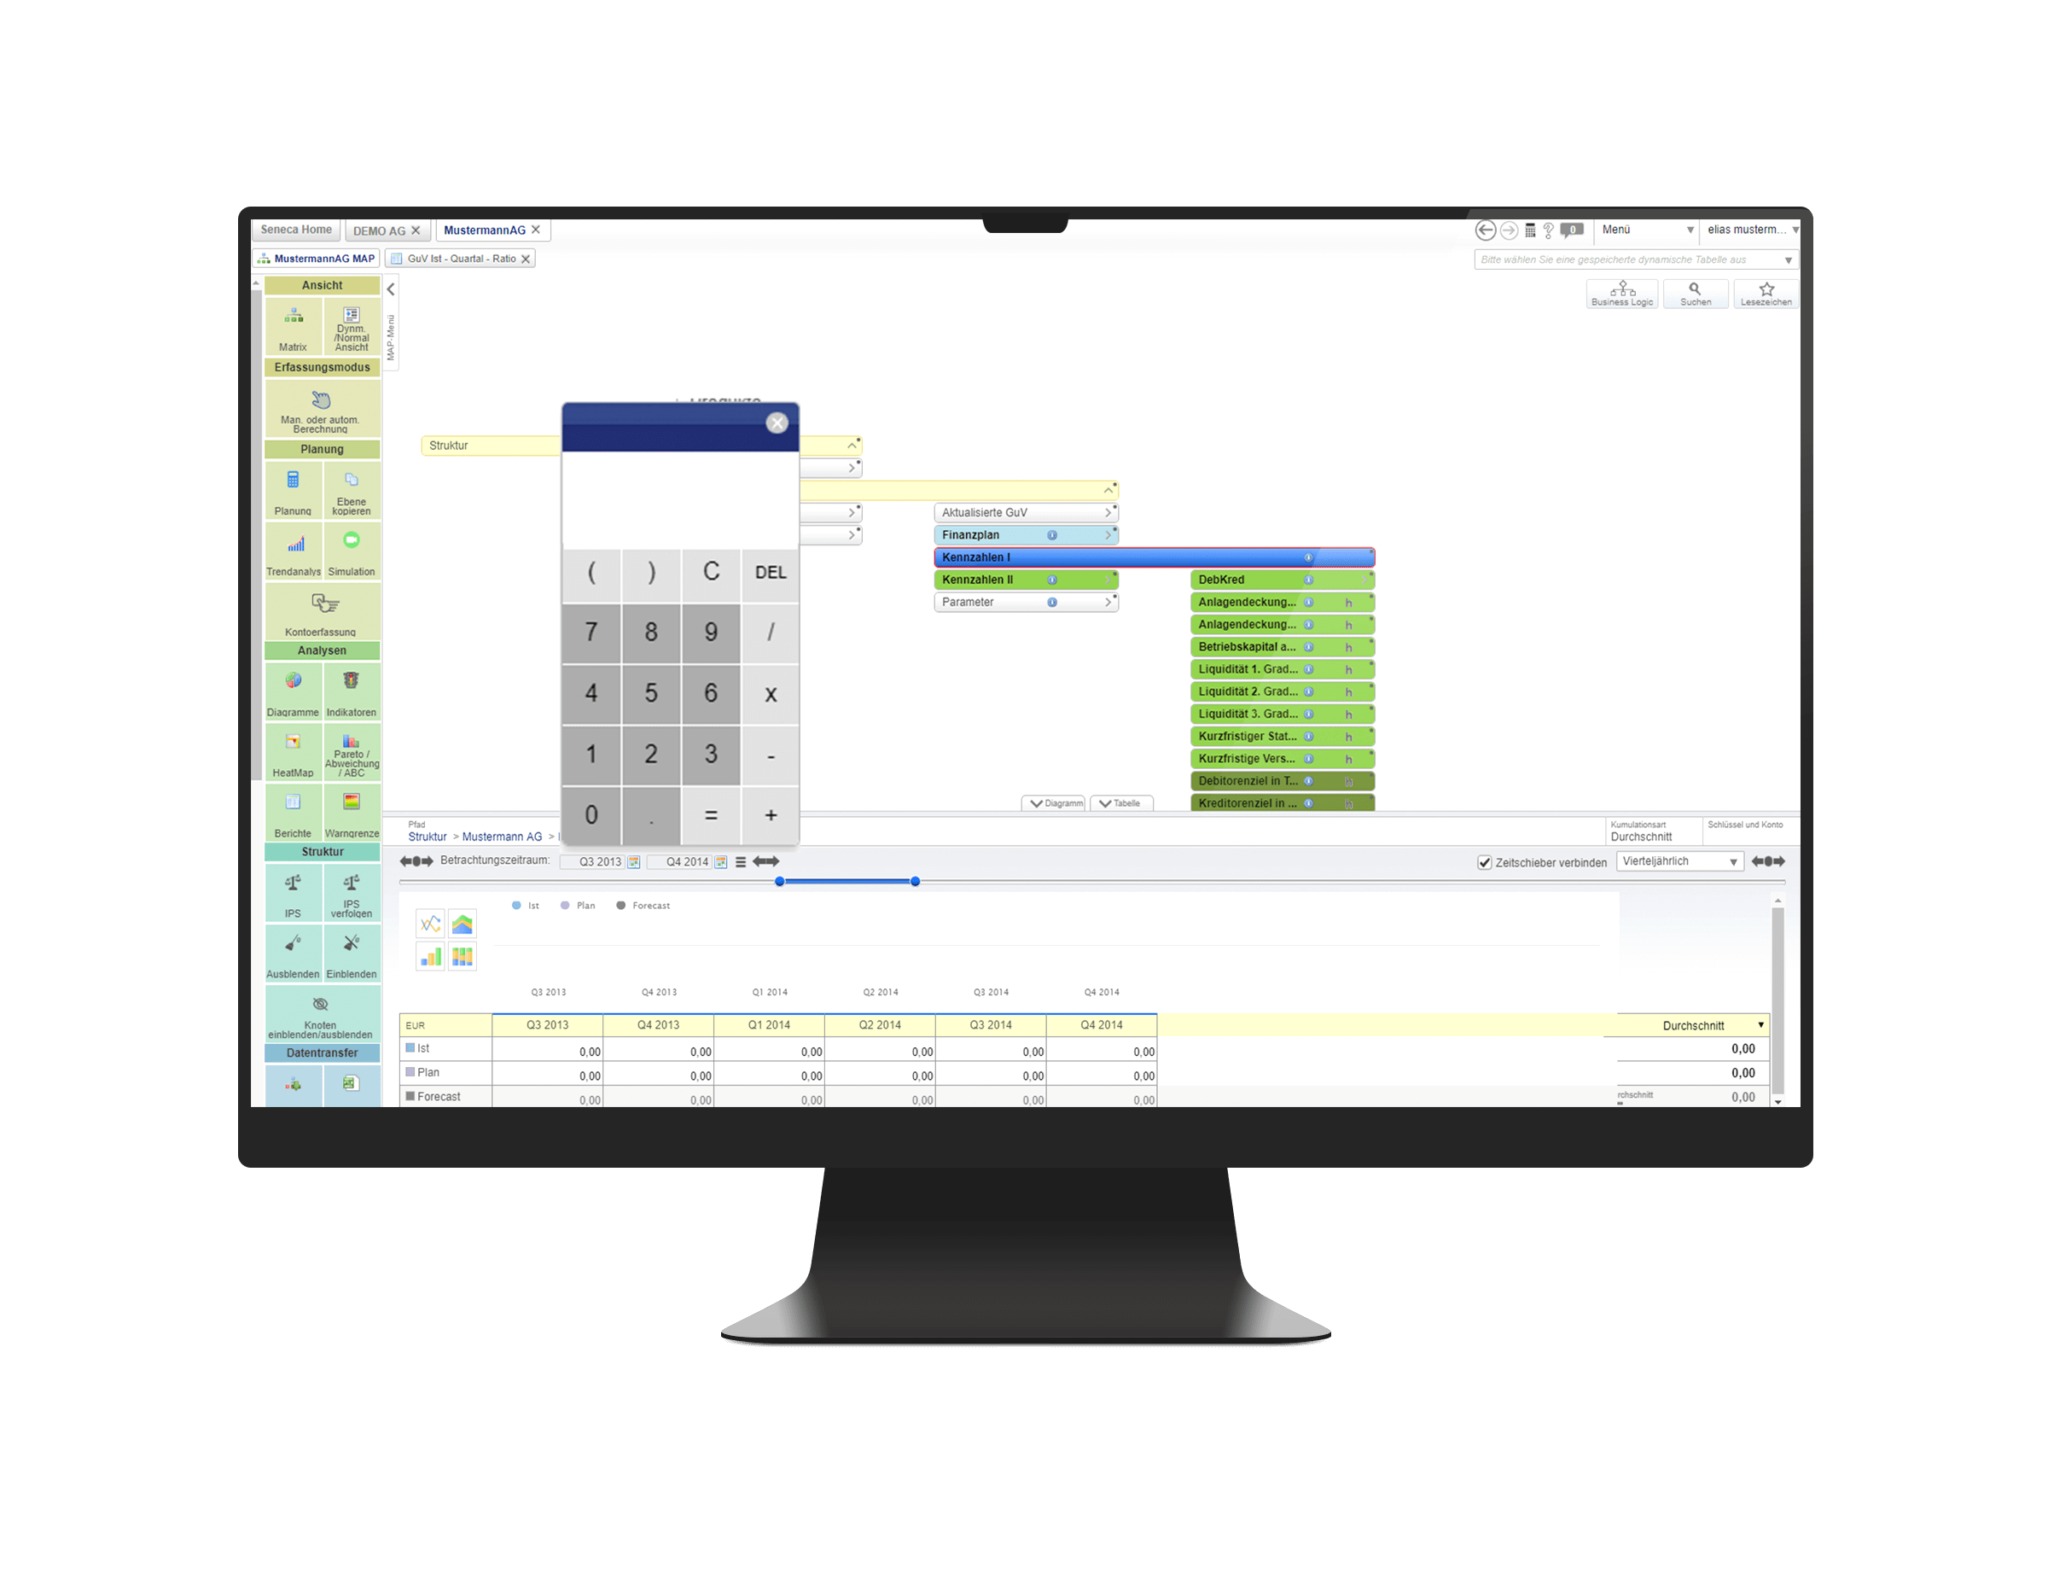
Calculator
The additional calculation for planning made easy
Simply use the drag-and-drop tool to copy the values of additional calculation from each sector of the system into the calculator. After the calculation process transfer, the results of your calculation back again into the corresponding table or function.
This is particularly useful for your planning projects and saves navigation clicks via tabs or data transfer by using copy/paste.
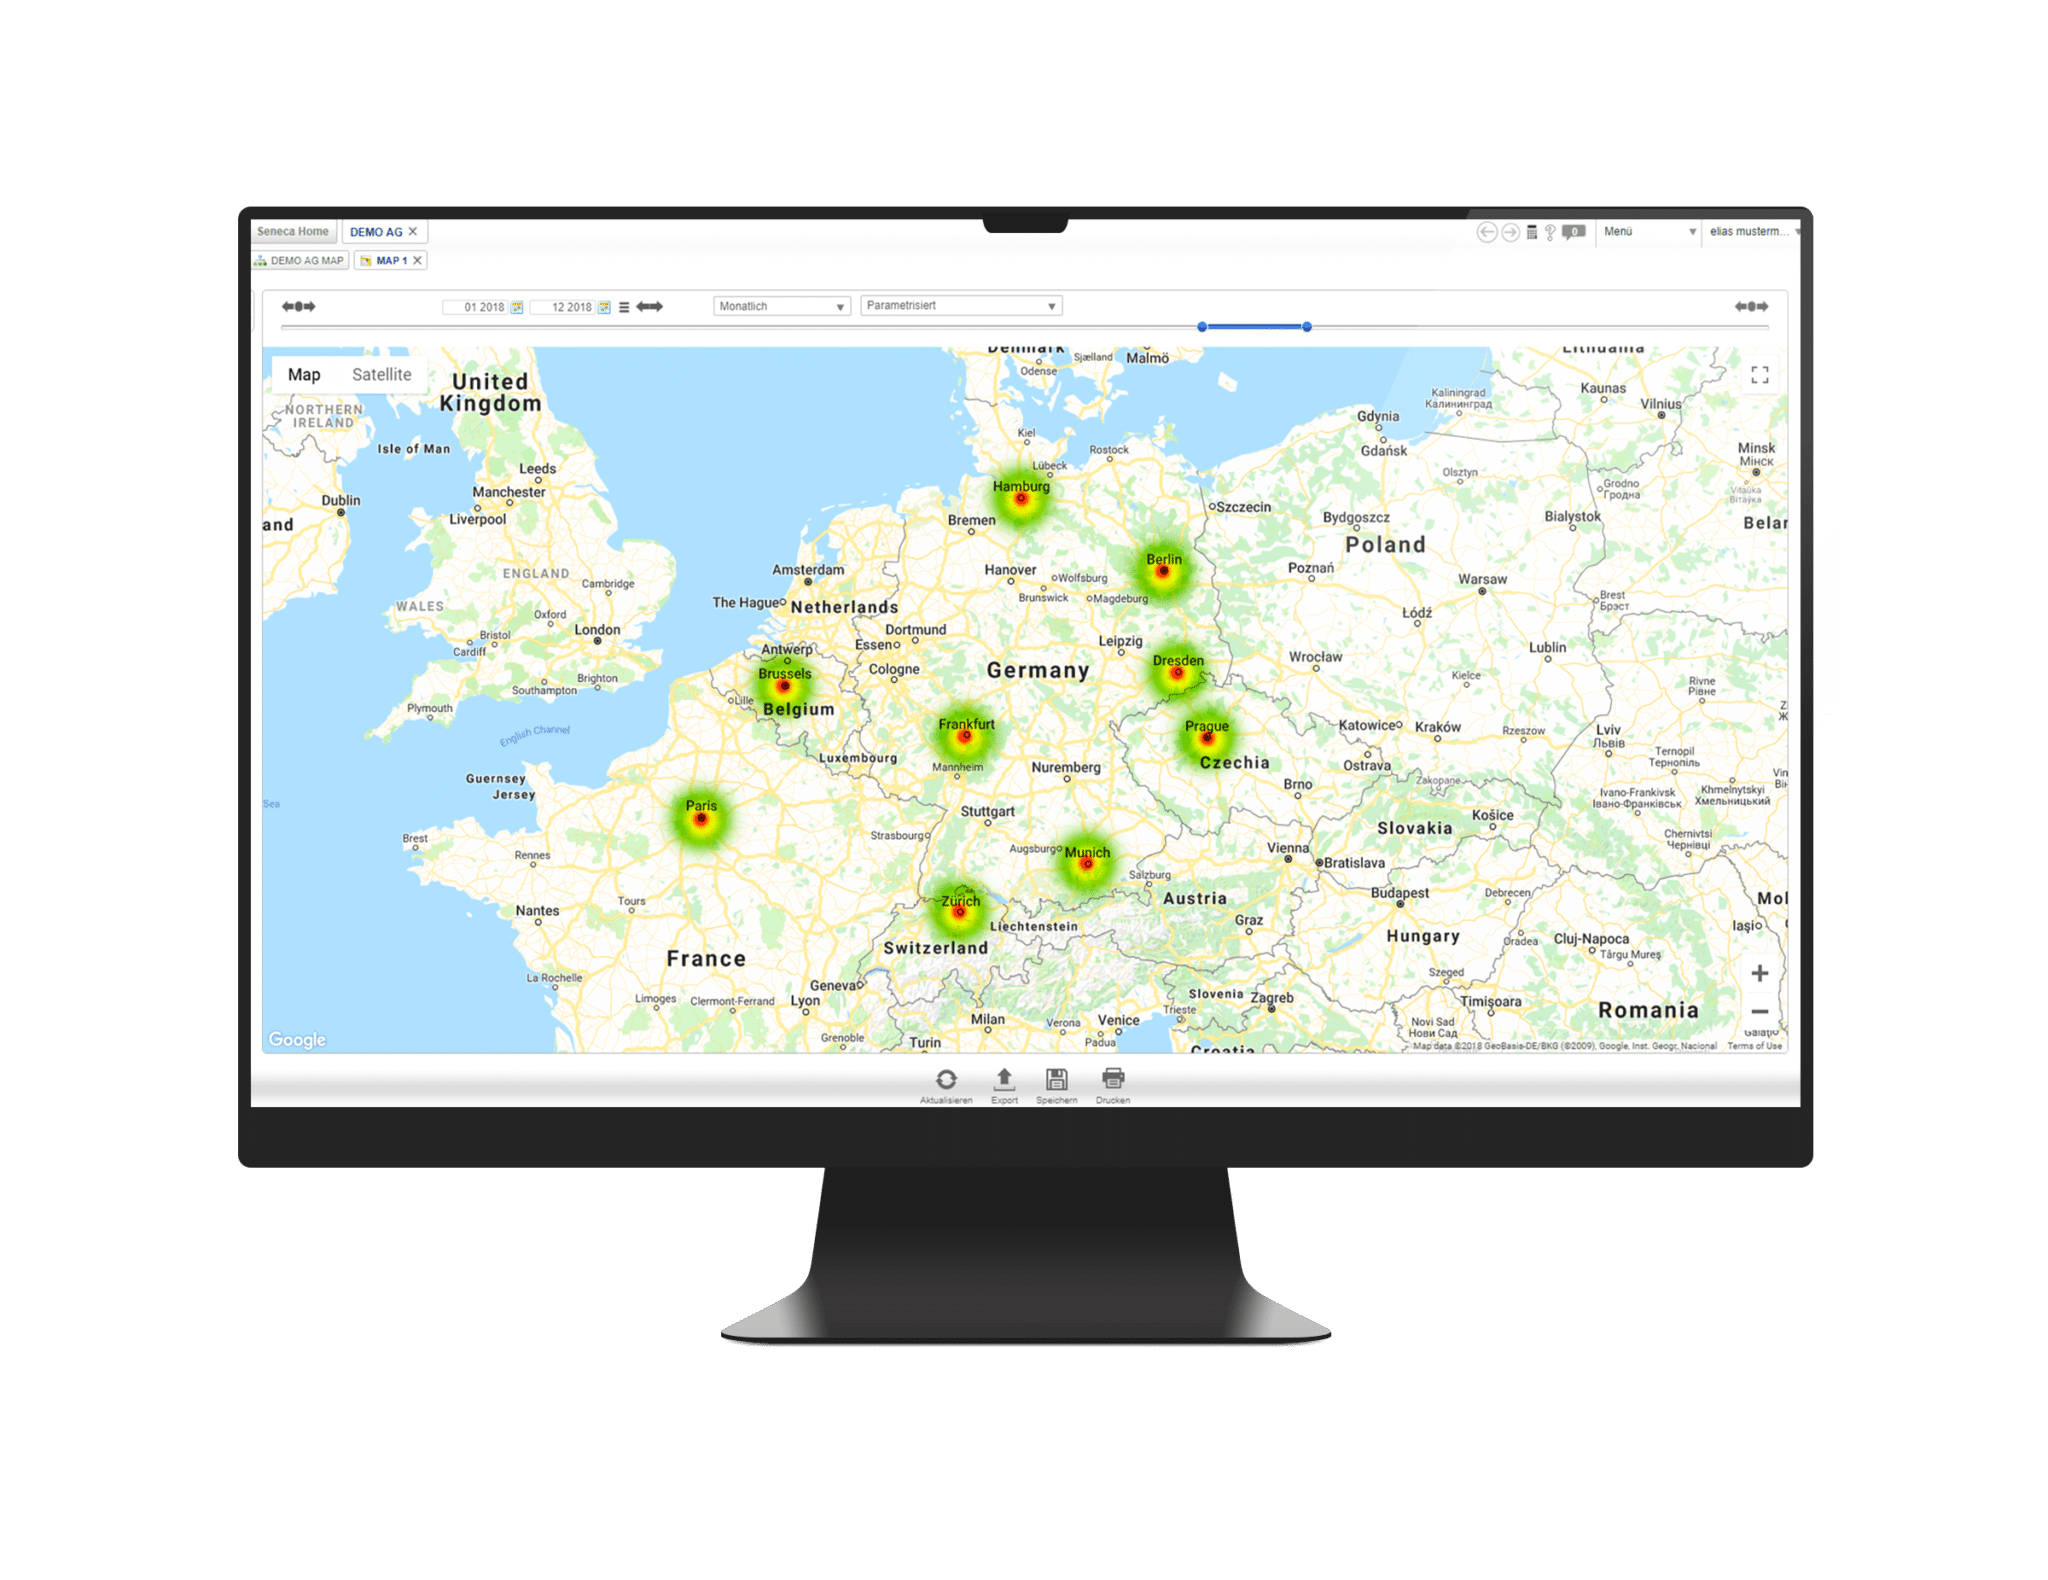
Heatmaps
Catch a glimpse at your company’s world!
Use geocoded information to illustrate your sales and your costs transparently on a map.
From detail view up to global view. Identify geographical focuses of your sales network or optimize logistical processes.
Multi-tenancy
Full flexibility and scalability
Seneca enables you to figure as many companies individually as you wish and to portray single contents like sales, staff or cost centres as a client.
Take the structure out of your ERP and accounting system, consolidate cross-client information and present any number of those contents like P&L, balance sheets, clients or products. Seneca adapts to your needs.
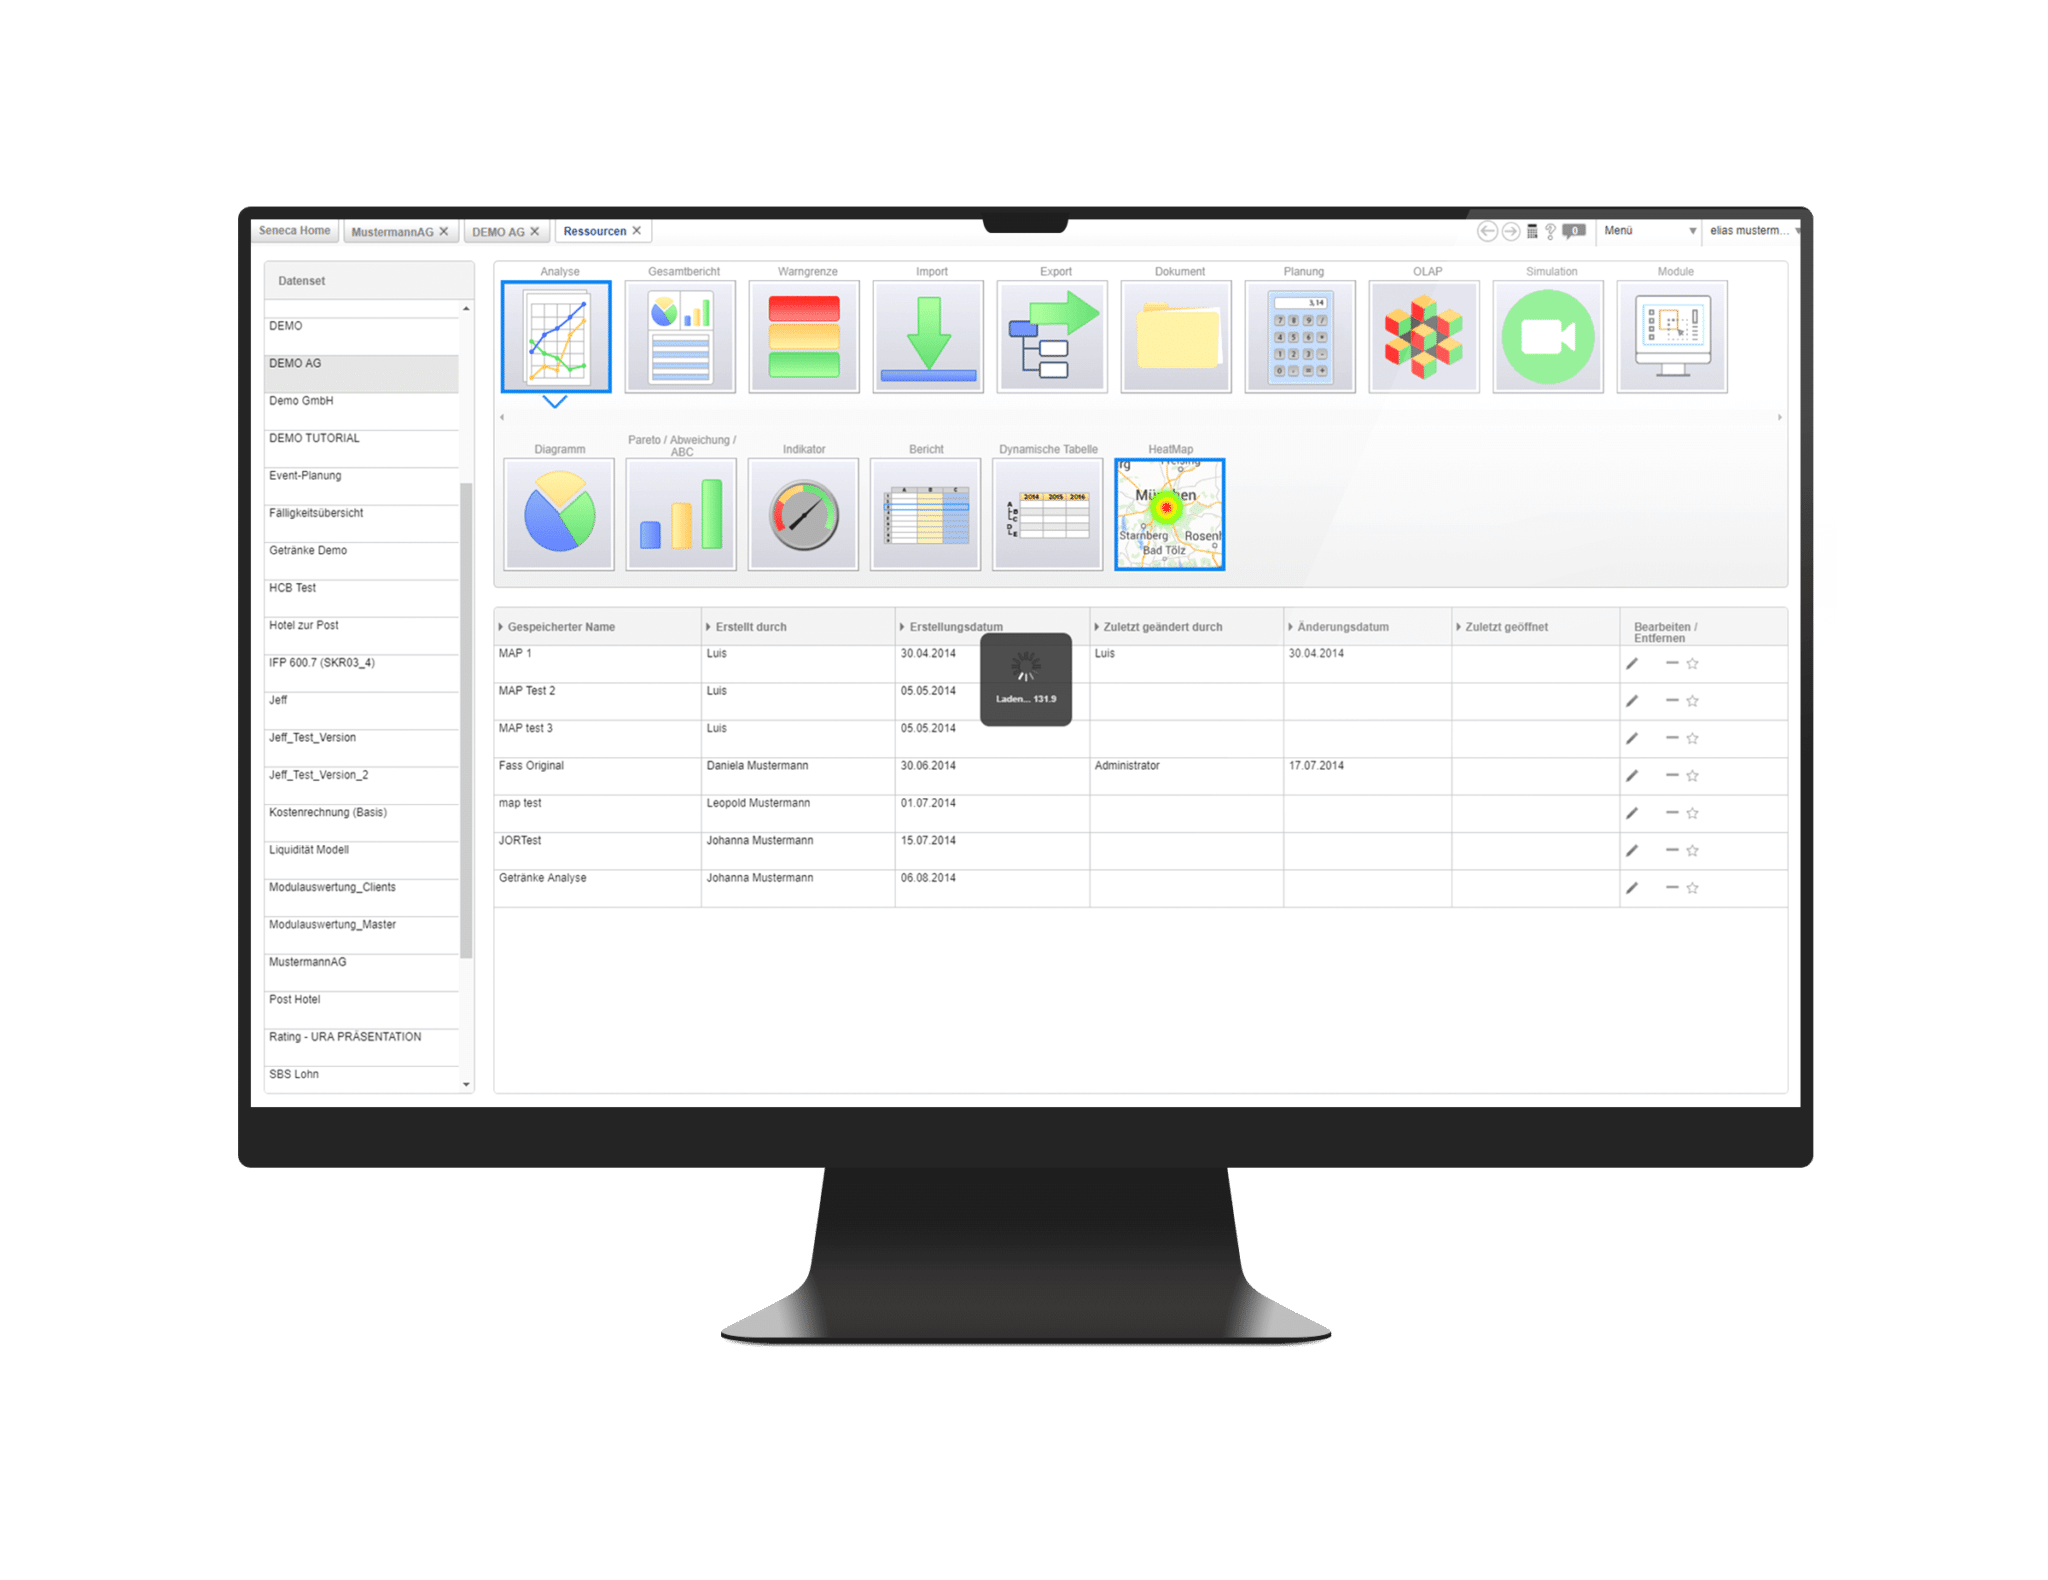
International use
With Seneca, you are working globally
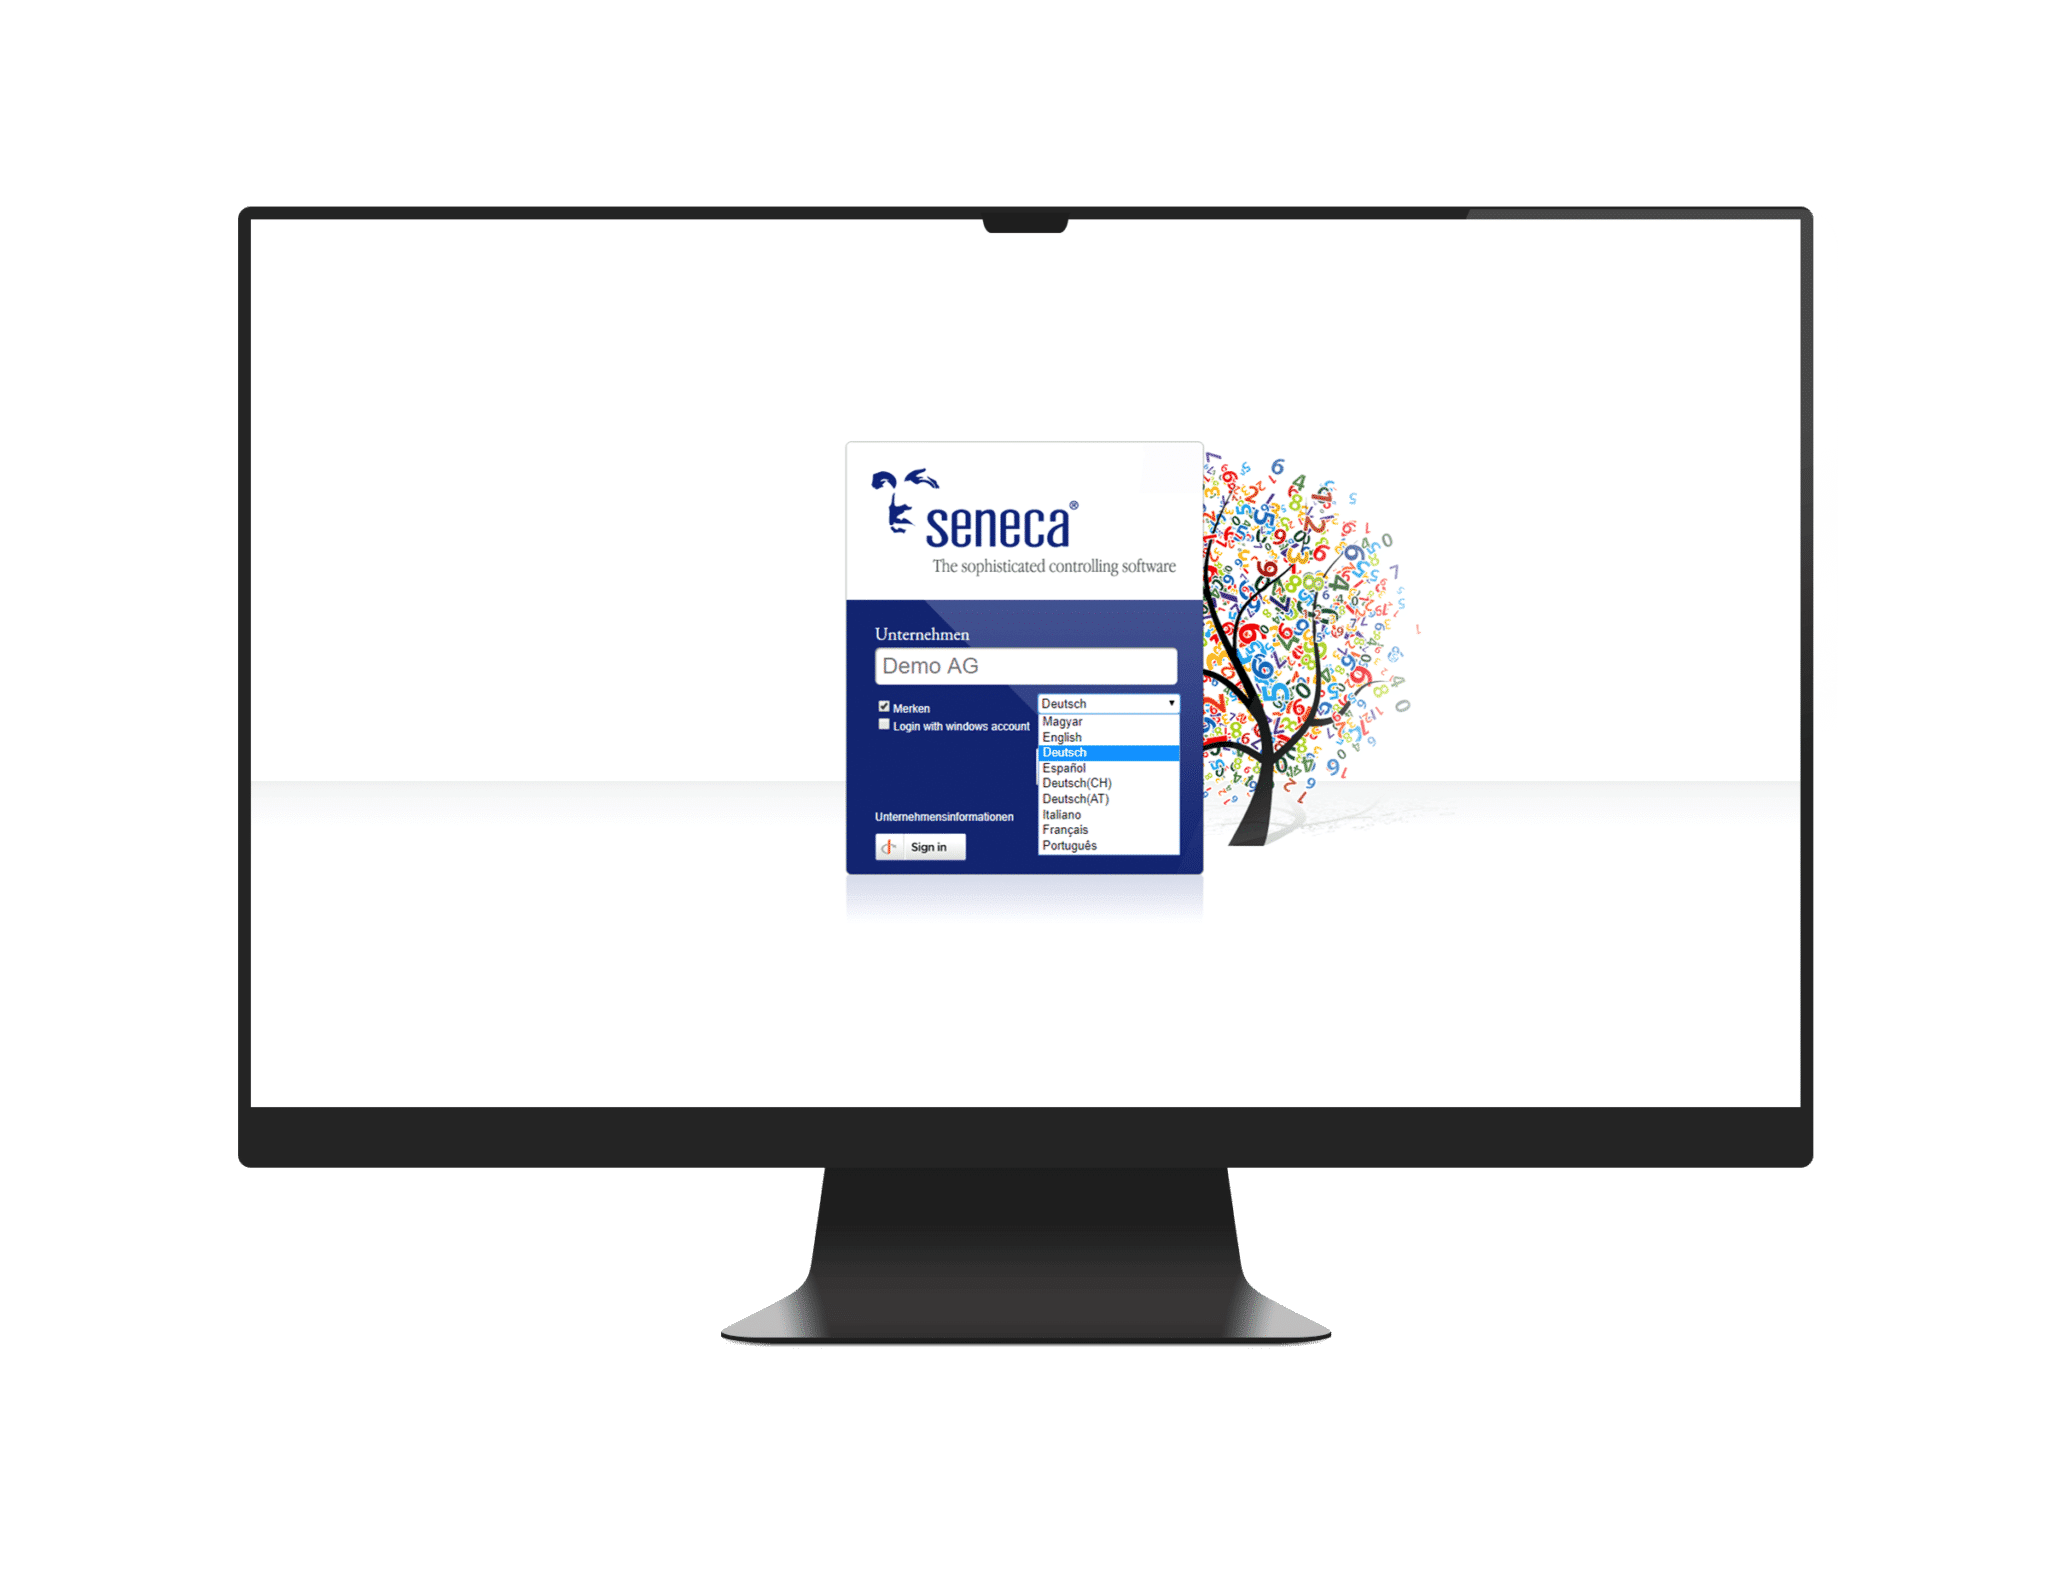
Each user chooses his prefered language. Program and individual structures will be adapted to the chosen language and international accounting.
The linking to the European Central Bank (ECB) enables your data to be up-to-the-minute.
Chat and workflow
Work together efficiently with your team!
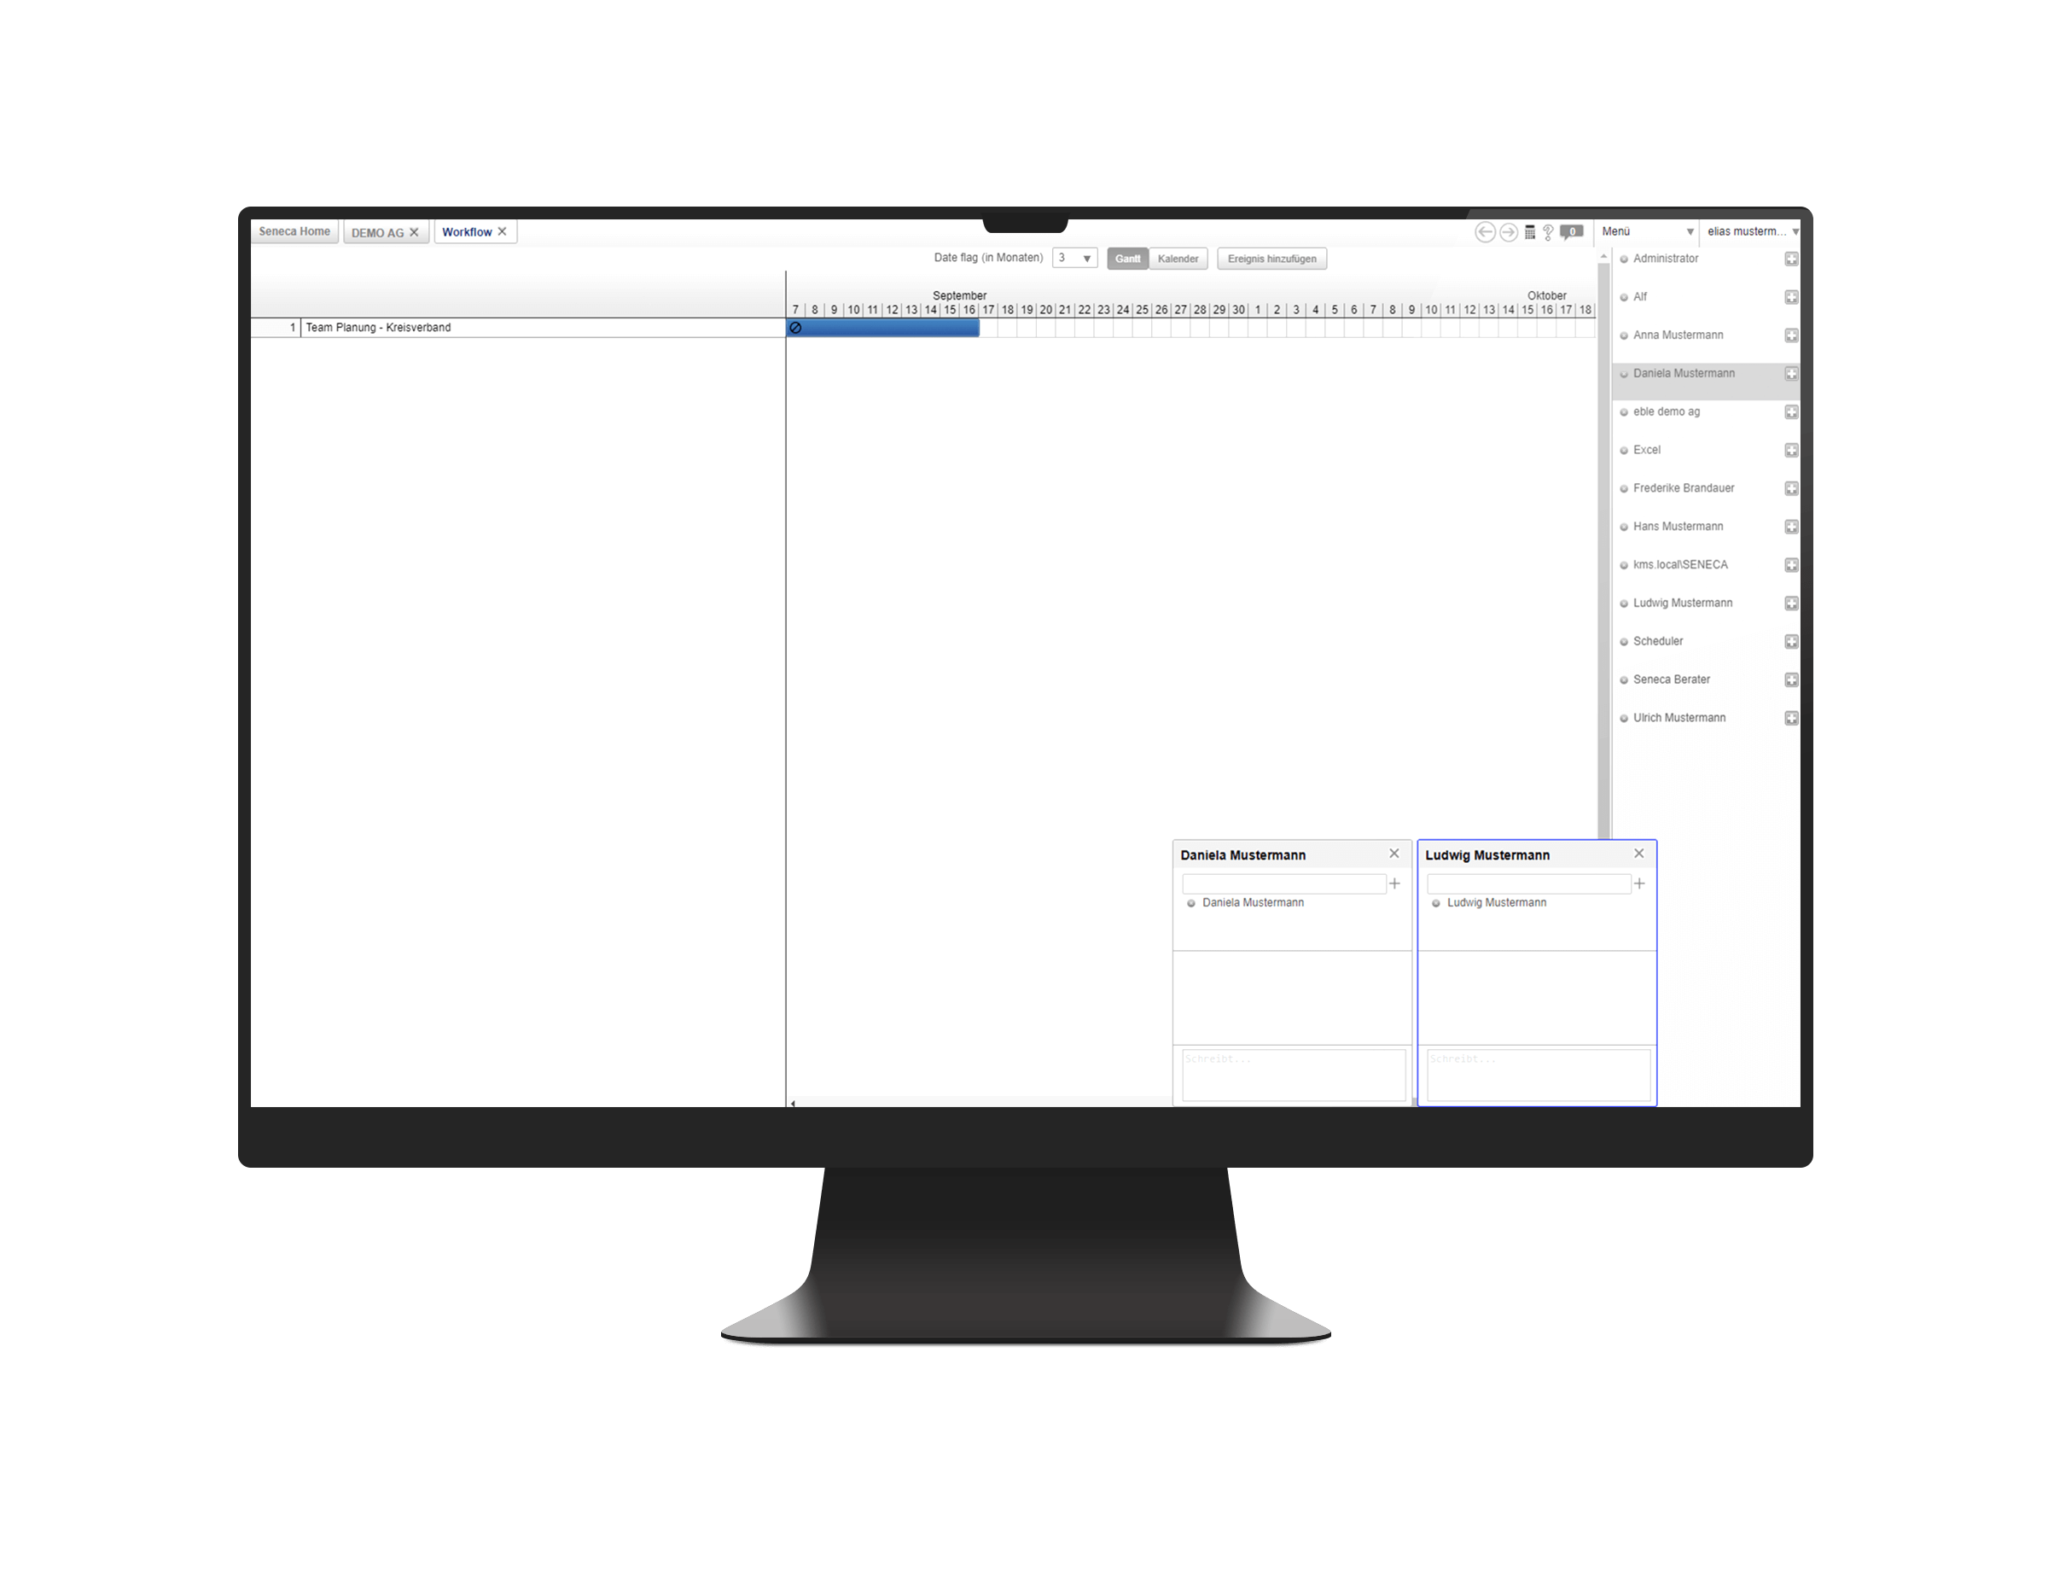
See, who of your team is available and come into contact instantly. This chat function can be used without any installation.
Coordinate planning and projects in a group and determine appointments and responsibilities. Visualize the procedure in Gantt charts and keep yourself up to date with the reminder function. You will keep your corporate processes under control easily.
Editing function
Create your business model!
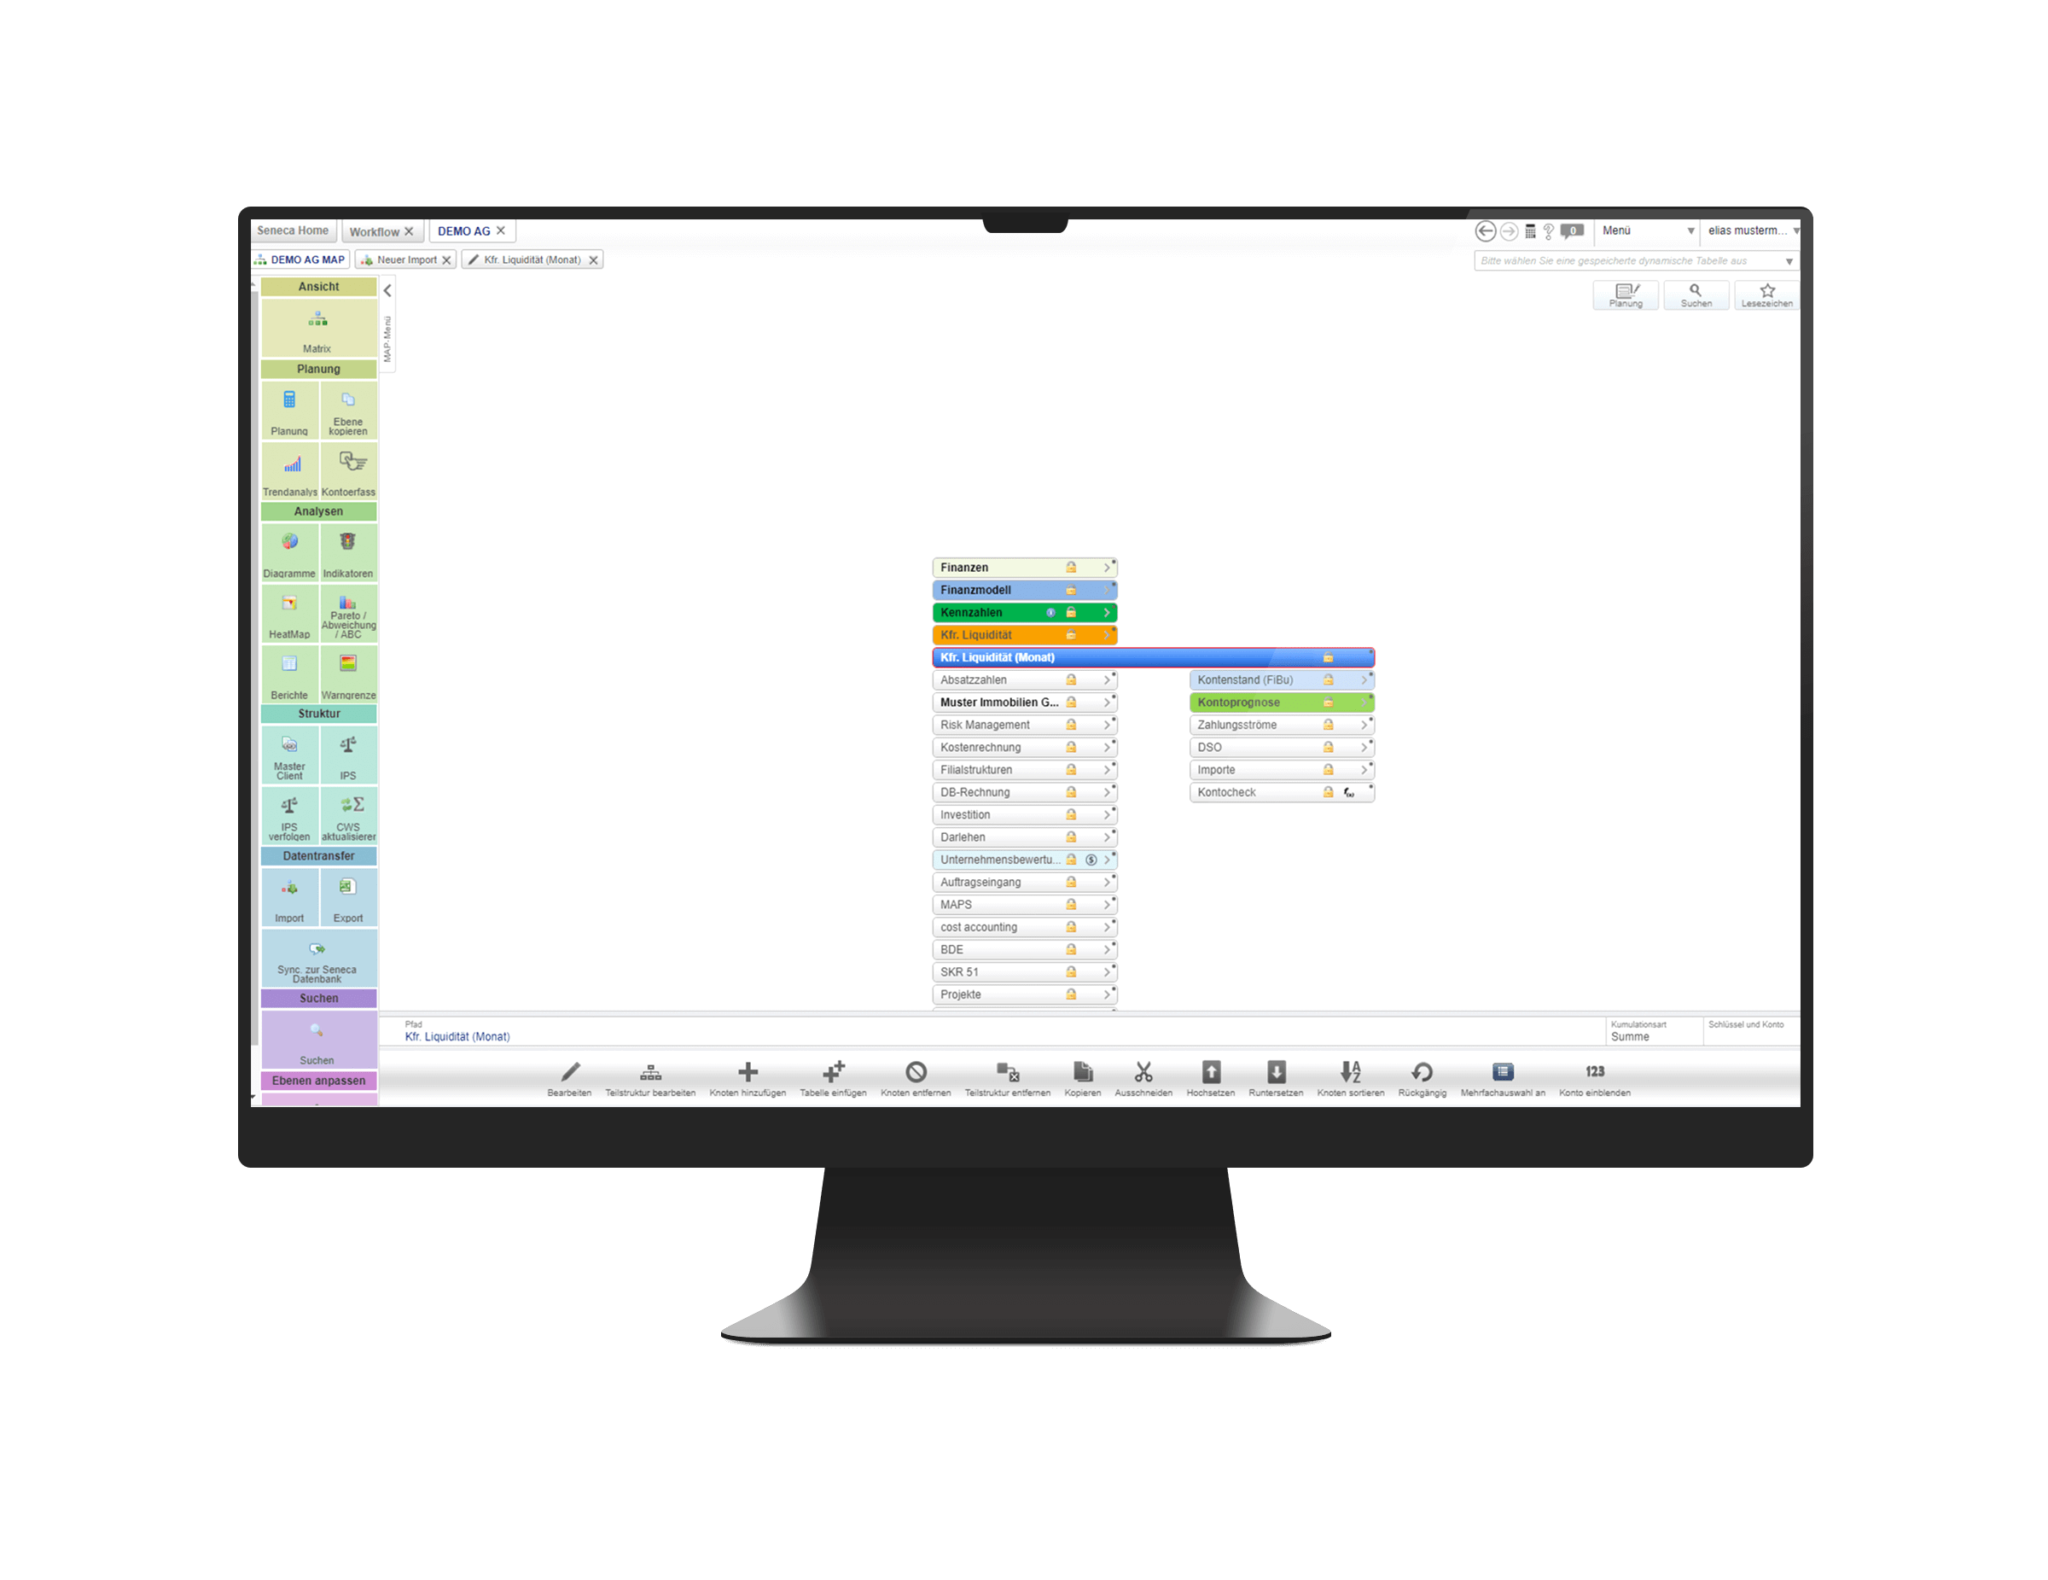
Present different business models quickly by creating any position via drag and drop. Change existing structures quickly or create your template.
Adapt your reports to your business model and present your contents in individual reports. At the touch of the button, it is possible to adjust periods as requested – even over the years. Reports and analyses can easily be adapted to your corporate design.
Import and export of data
Integrate Seneca into your IT environment
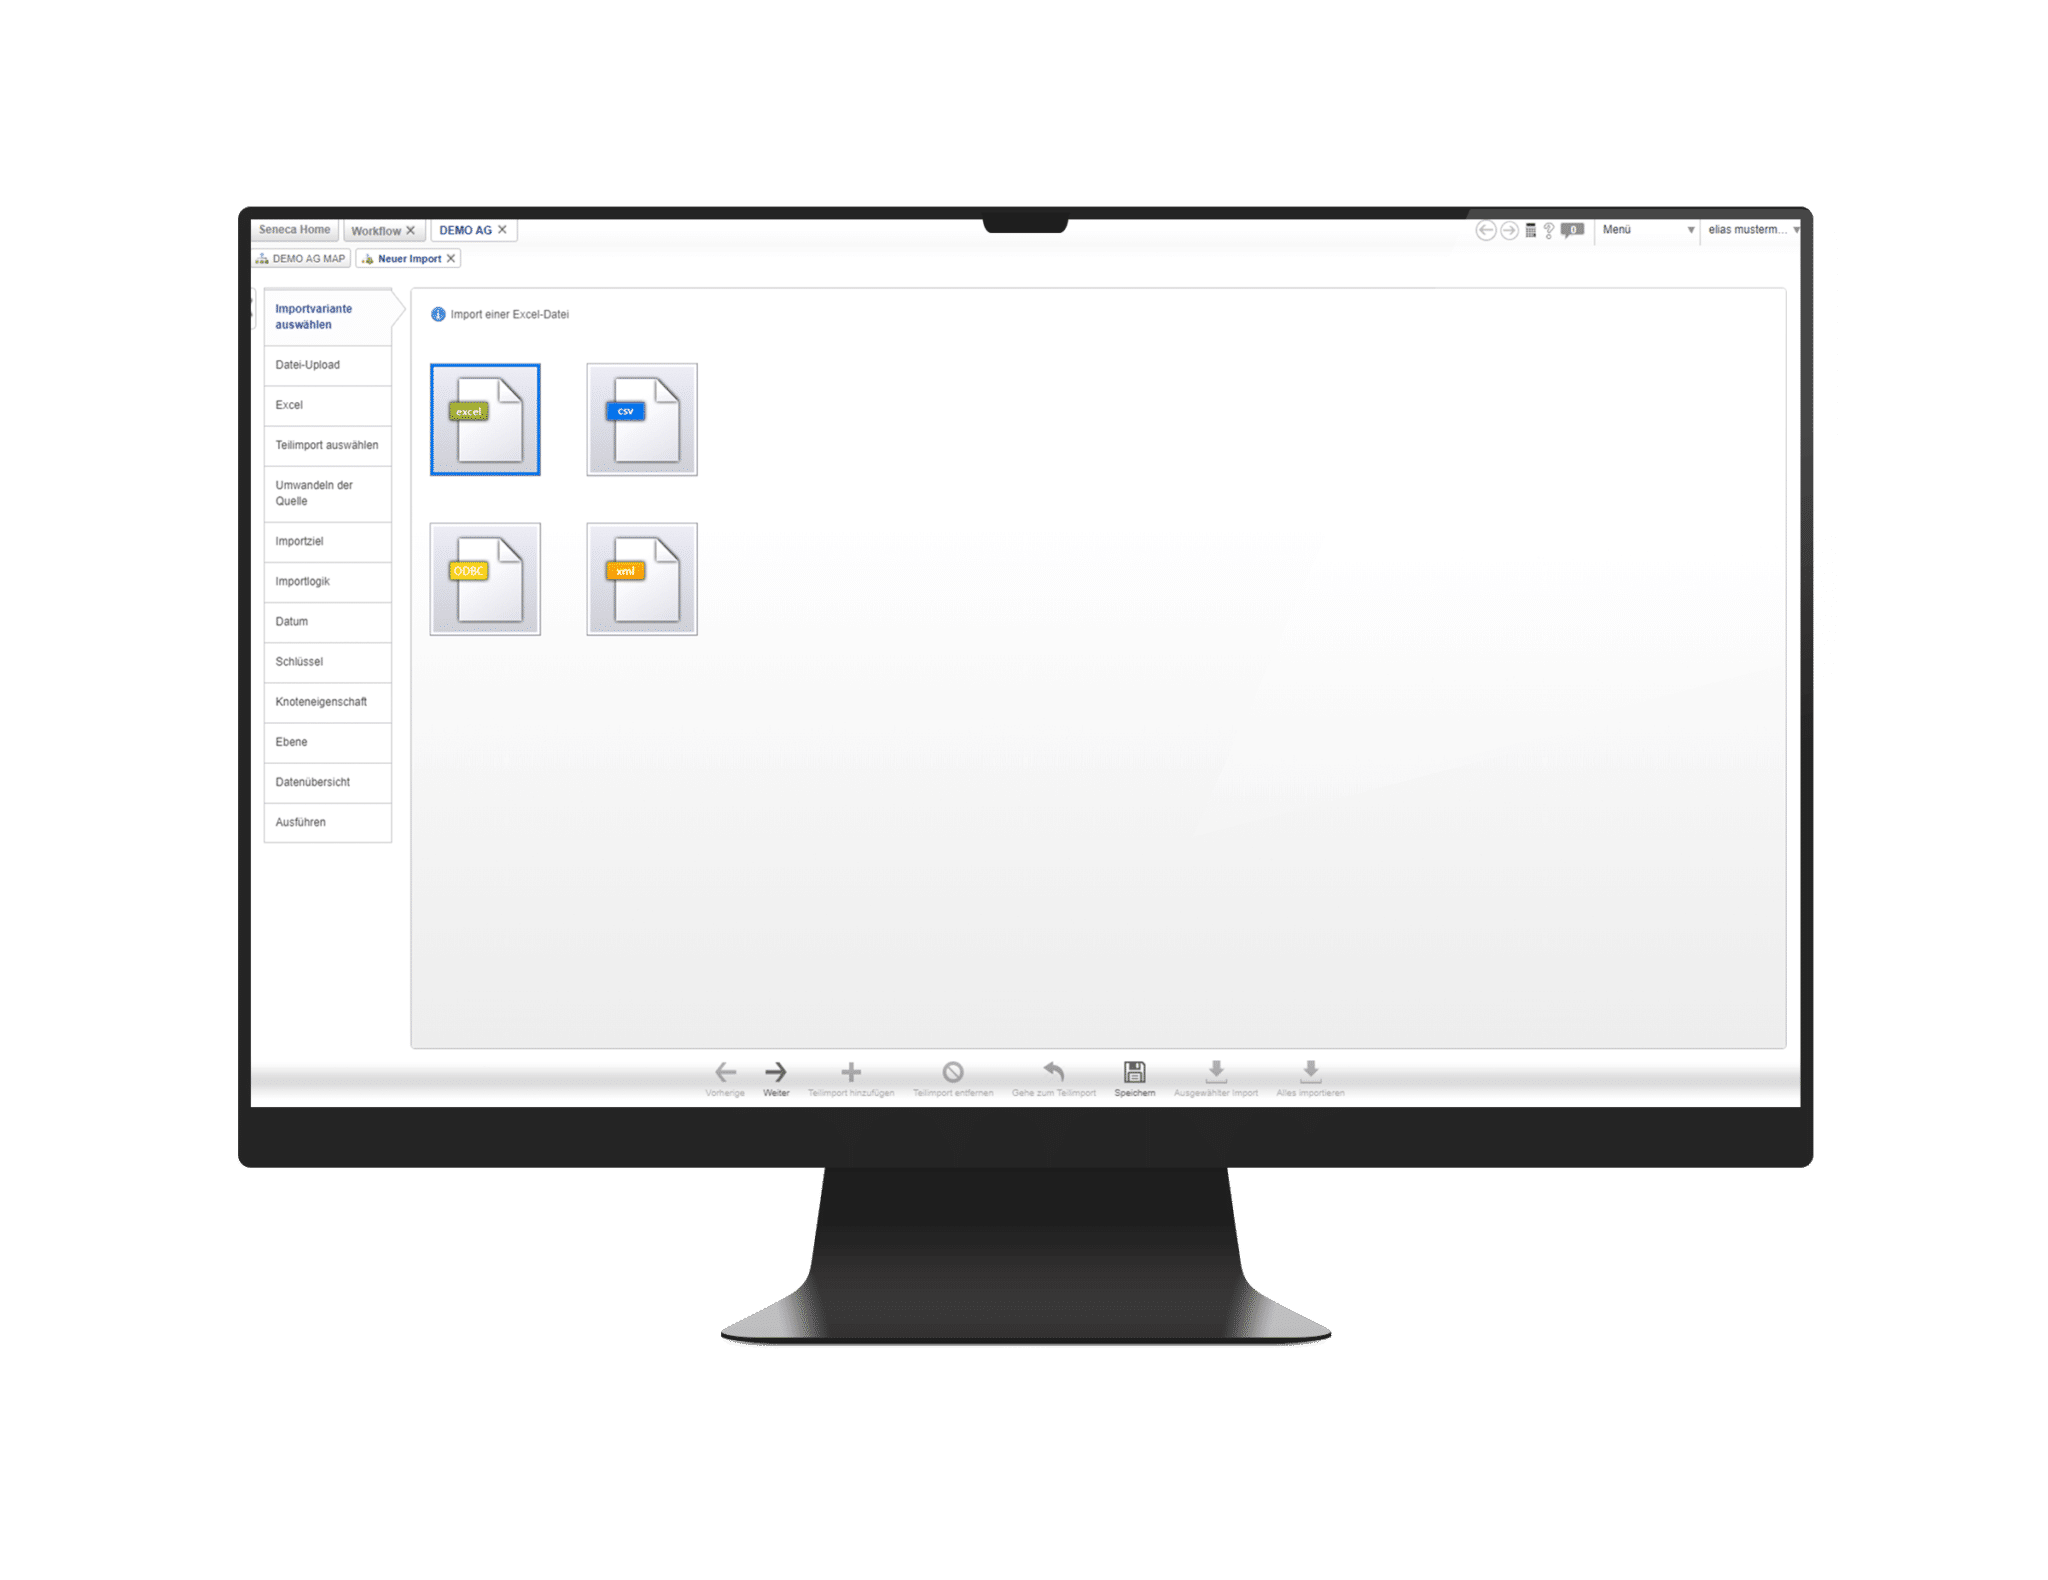
Due to the easy-to-handle Interface Wizard, you can hand over data in various formats very simple. Data consolidation becomes a walk in the park!
Export your data from Seneca as XML, CSV, Microsoft Excel or directly from database to database. You can format each report, chart and analysis as PDF or Excel and host it in the Seneca FTP storage.
The Seneca MS-Office-Add-In completes your systems integration.

Test us, free of charge and without obligation!
After submitting the contact form, you will receive the login data for your 30-day software trial access at the e-mail address you provided. The Seneca Support Team will also contact you immediately by telephone, answer your questions or, if you wish, guide you through the program in an online session.

